Tableau Tutorial
Basic
Charts
Statement
Functions
Sort/Filters
Tableau Dashboard
Advanced
Interview Questions
Tableau Tutorial and Resources
Tableau is a data visualization tool widely used to create Business Intelligence reports. These reports help represent data in a graphical or more readable fashion with user-friendly possible interactions. Interactive dashboards with proper labels and the ability to modify filters or selections and revise the views have always been an advantage for Tableau in consulting services. However, to derive insights and take action on them, it is essential to convey the message through proper storyboarding. This tutorial focuses on how to make effective communication through data representation in Tableau. Tableau has emerged as a leader in GARTNER MAGIC QUADRANT for seven years from 2012 to 2019 consecutively.
Why Do We Need to Learn Tableau?
- Tableau can acquire data from relational databases, cloud-based databases like Amazon Web Services, Microsoft Azure SQL database, Google Cloud SQL, and spreadsheets stored on any environment like Hadoop data servers to create reports. Moreover, it can summarise large datasets into effective visualization with a fast response time due to its ability to store in-memory data.
- There are various features of Tableau that make it a powerful visualization tool. One of the essential features is Data blending, or Data joins from multiple data sources. This enables the representation of metrics or parameters obtained from fields present in different data sources without any ETL need. In addition, various operations like aggregation, concatenation, and data typecasting can be done here.
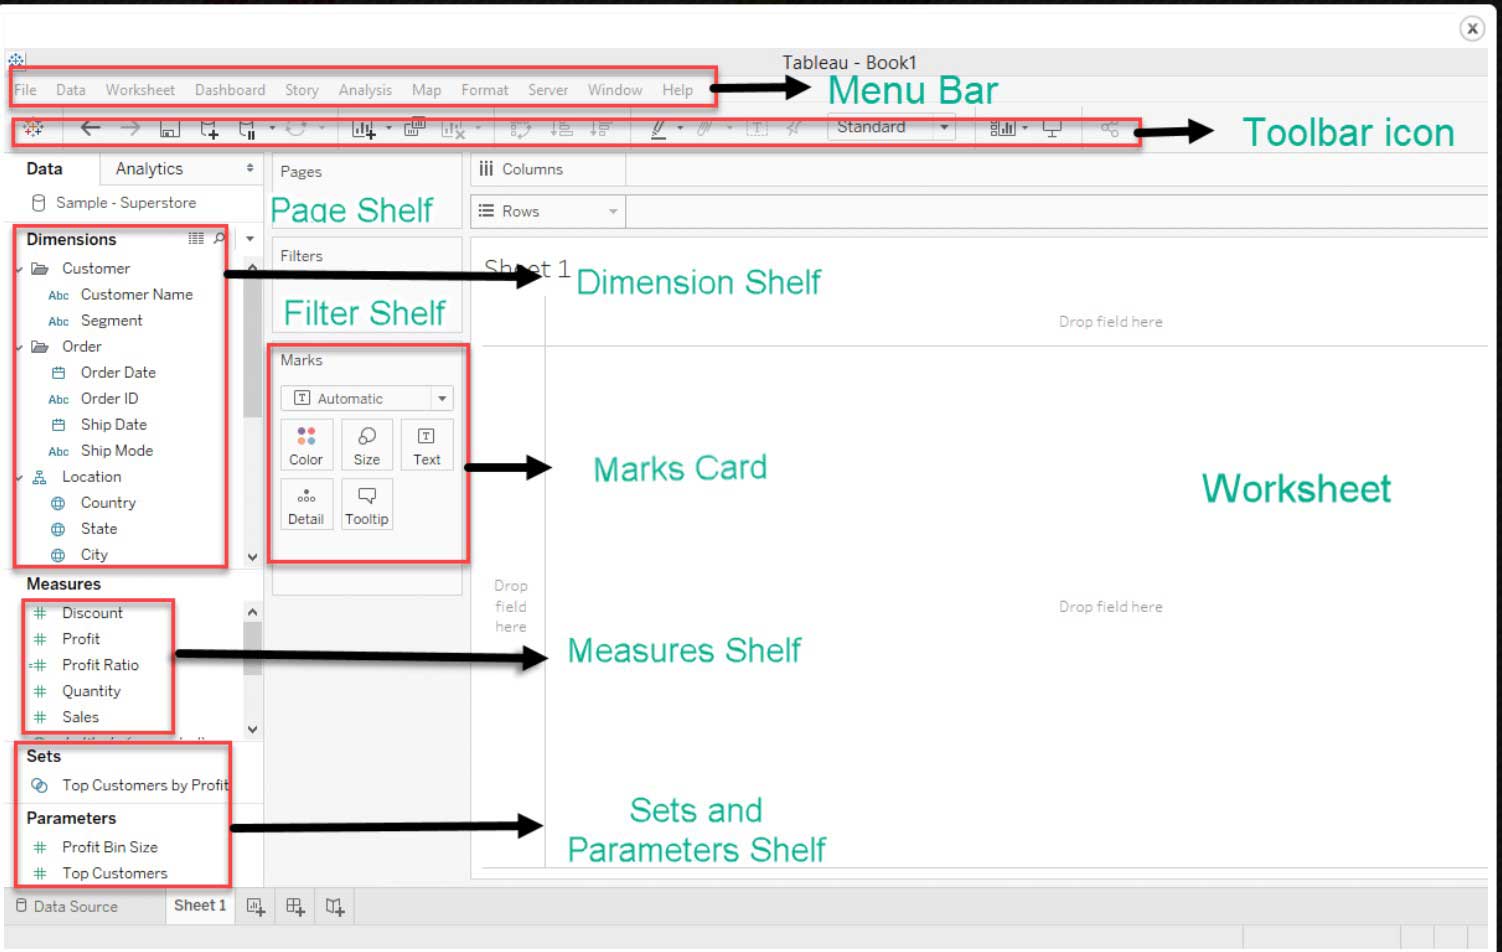
- Tableau comes with a huge community that supports users in solving their queries easily. This is an advantage for the beginners who would learn through tutorials and, while practicing, can get added to the community for suggestions. Below is the main dashboard of Tableau Public after signing in, with toolbars and panels for creating visualizations:
Applications of Tableau
- Sharing MIS or BI reports with users or clients becomes easy with Tableau products like Tableau Reader or Tableau Server. This helps in collaboration and faster response time on any actions.
- Cluster Analysis can be performed in Tableau with the K-means algorithm.
- Using Tableau, interactive dashboards can be built with GUI and filtering options as simple as drop-downs. Geographical maps worldwide help in beautifully representing data on maps, in combination with Tree or Heat maps.
- Tableau has a powerfuStoryboardingng feature that helps create executive-level summaries and views self-explanatory.
Pre-requisites
Before learning Tableau, basic knowledge about querying and summarizing data as in data analysis will be helpful. SQL will be an added advantage. Understanding graphs, charts, tables, views, and mathematical calculations to obtain business metrics, will make this effective tutorial learning.
Target Audience
This tutorial targets Big data analysts, Data scientists, and other readers willing to create Business Intelligence reports and modify them on a daily basis for business needs and better data visualization and real-time collaboration. With Tableau Public desktop, connecting spreadsheets and creating dashboards becomes easy.
Valuation, Hadoop, Excel, Web Development & many more.