Updated March 22, 2023
Introduction to Trend Lines in Tableau
Trends provide important insights into the analysis; it highlights trends in data. Tableau creates trend lines with dimensions and measures fields. To add trend lines in data, both axis must contain numbers (columns and rows). For example, tableau will not create a trend line for city or country dimension because it does not contain numbers.
Mathematical models are used for creating trend lines. Tableau provides for five trend line options – 1. Linear 2. Logarithmic 3. Exponential 4. Polynomial 5. Power
With the help of trend lines, we can see the trend present in data. We can highlight trends in the data we have. Because of the tableau, we can publish a view that contains trend lines or share a view that has trend lines to others.
How to create a Trend Line in tableau?
Below are the steps for setting up a trend line in tableau.
- Open tableau application.
- Open data source.
- Drag the order table into the workbook.
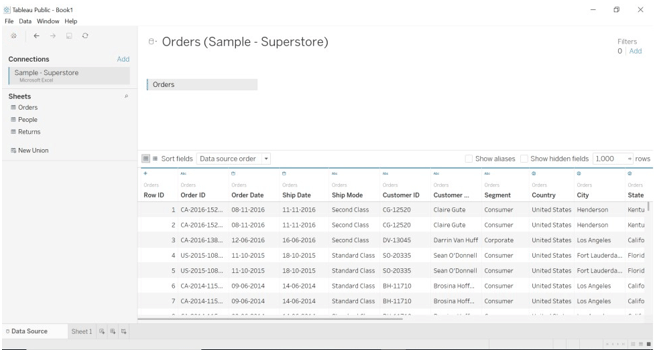
- Go to the worksheet.
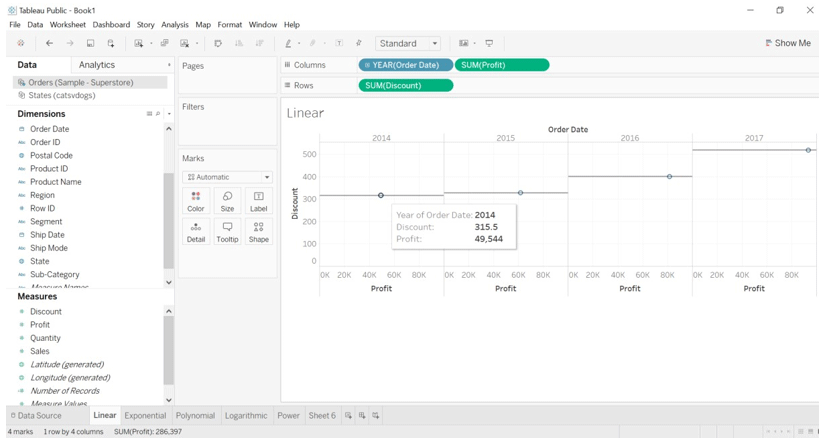
- Drag Order date (dimension) and Discount (measure) into columns and rows.
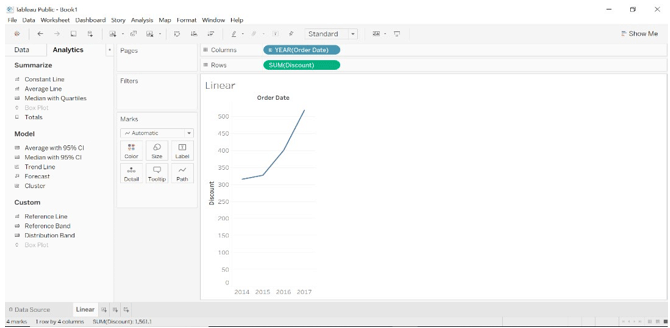
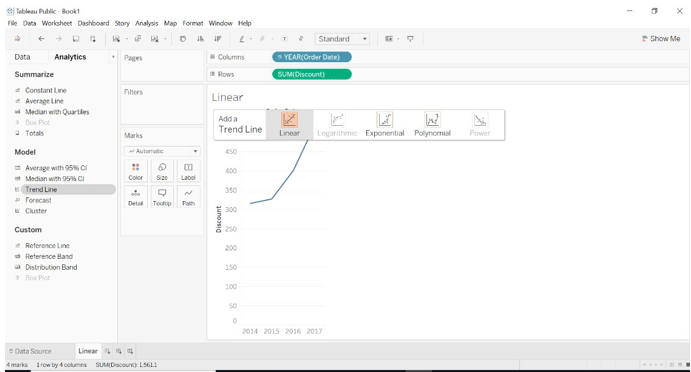
- Go to the Analytics pane, select Trend Line and drag it overview created.
- Select the Linear trend line.
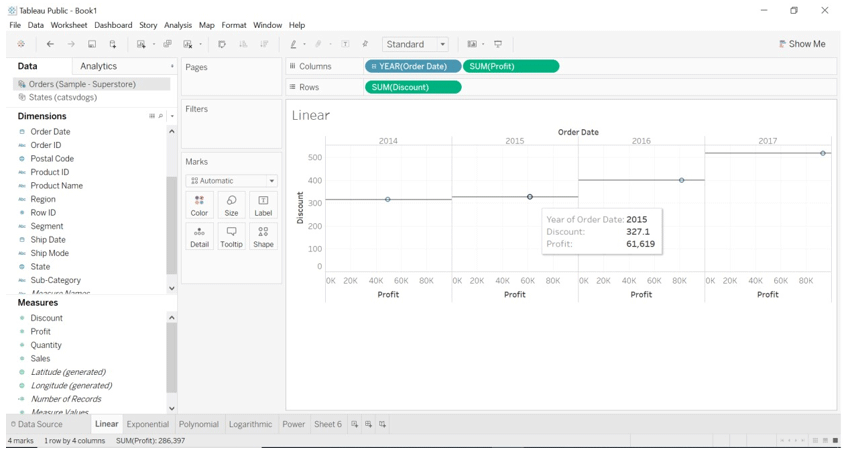
- The view will change once the trend line is selected.
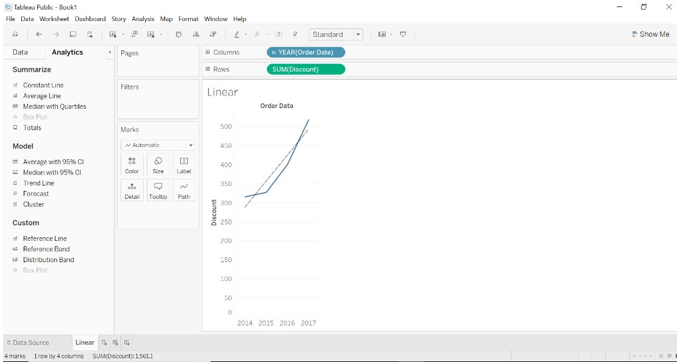
- We can see a description of the trend line created.

- Drag ship date dimension to columns and profit measure to rows.
- Go to the analytics pane and select the trend line.
- Drag trend line overview and select the Exponential trend line.
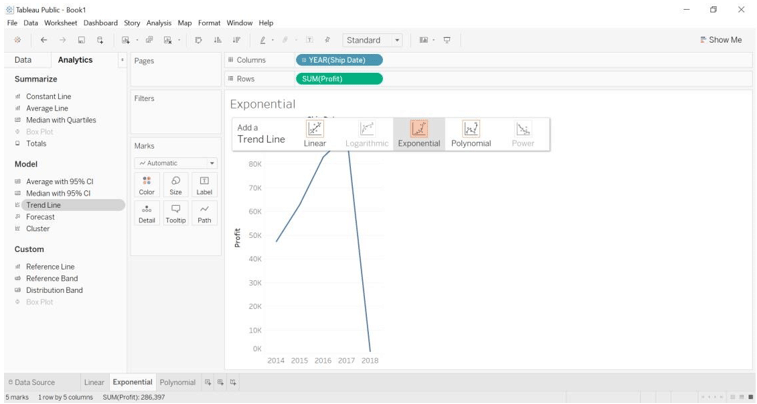
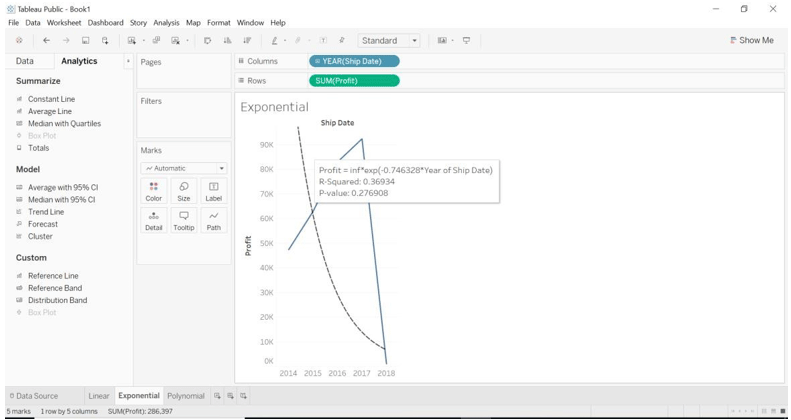
- The result will change once the trend line dragged.
- Hover over the trend line, we can see the description of the trend line.
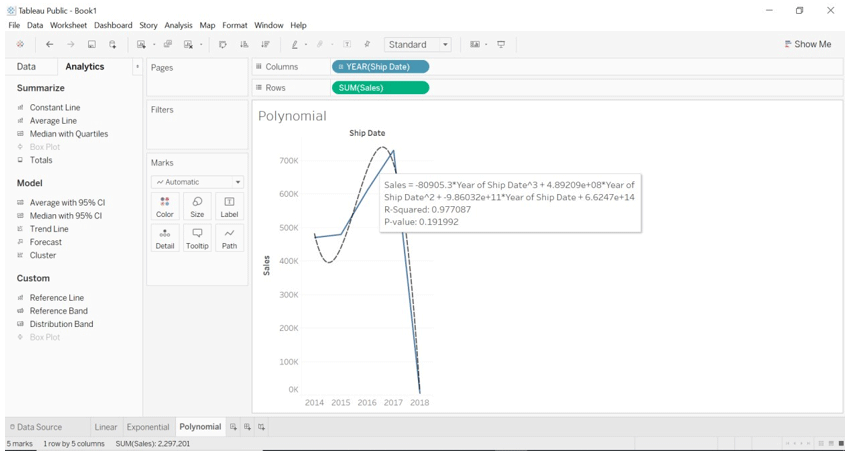
- Drag ship date (dimension) to columns and sales (measure) to rows.
- Go to analytics pane and select the trend line.
- Drag trend line overview and select the polynomial trend line.
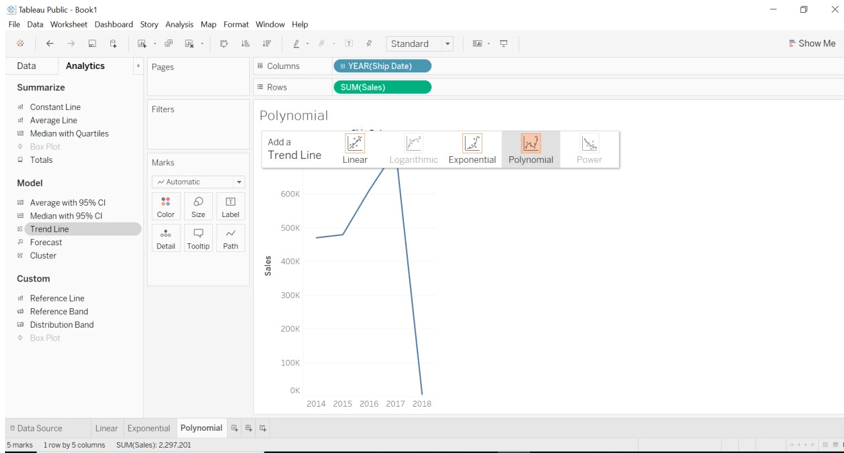
- Once the trend line dragged view will change and we can see the description of the trend line.
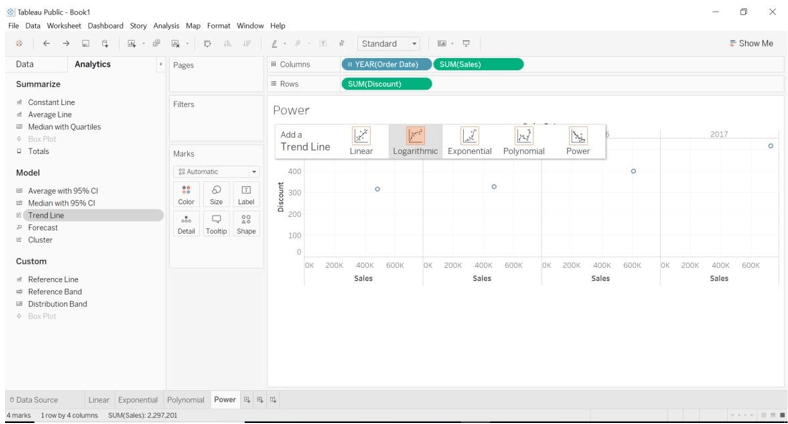
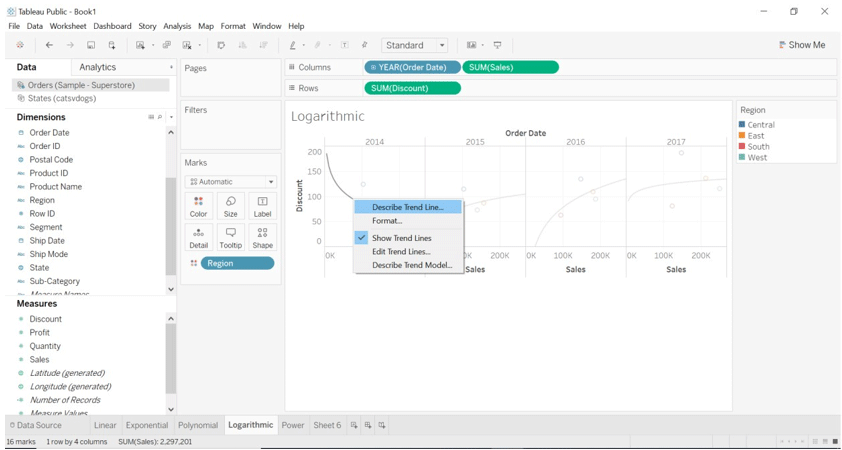
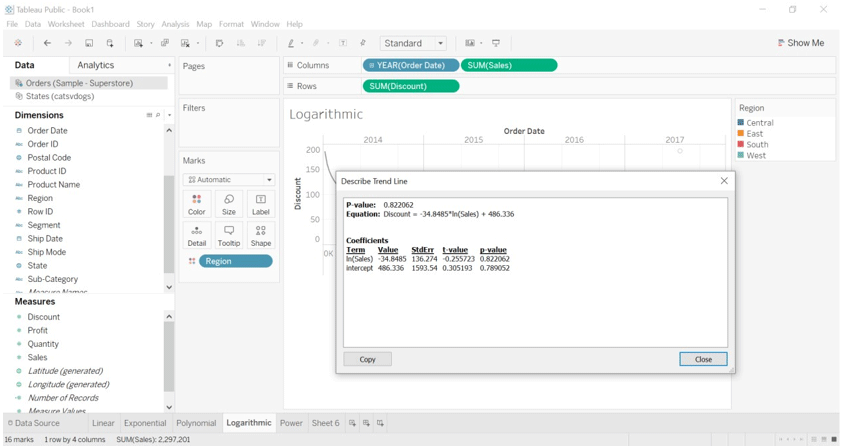
- We will draw the Logarithmic trend line.
- Drag order date (dimension) into columns.
- Drag sales (dimension) into columns.
- Drag discount (measure) into rows.
- Go to analytics pane and select Trend Line.
- Drag trend line as Logarithmic to view.
You will see the following image.
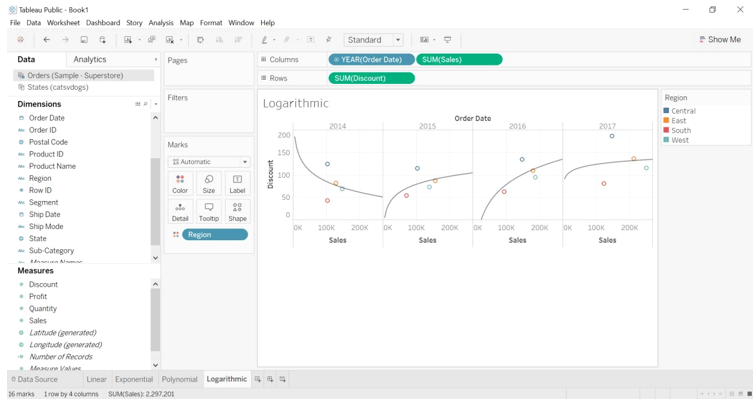
- Drag regions into colors.
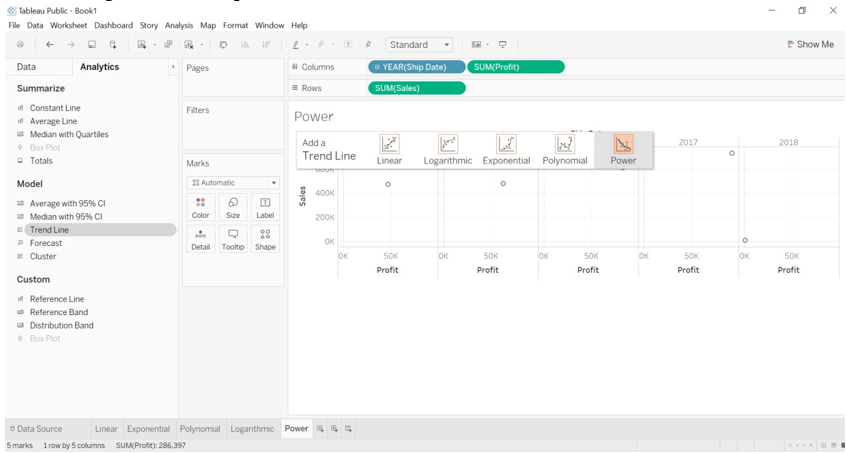
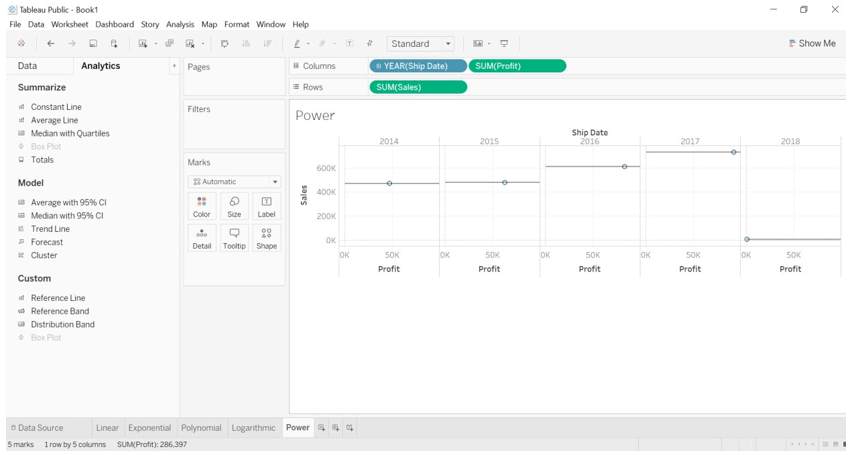
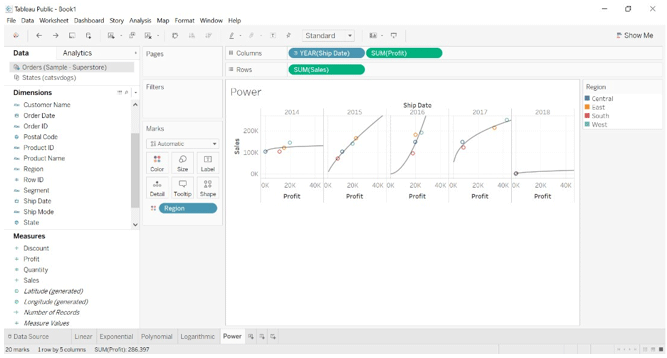
- We will draw the Power trend line.
- Drag ship date (dimension) to columns.
- Drag profit (measure) to columns.
- Drag sales (measure) to rows.
- Go to analytics pane, select trend line and drag it to view.
- Drag trend line to power as a trend line.
How does Trend Line Work?
Trend lines used for predicting statistical analysis of the data. Let’s say that it takes a reference to the linear model we have created. We can see in that example of how discount has increased each year. By calculating the discount, we can get a figure of profit we made in each year. We can calculate statistics of numbers with the help of trend lines. We don’t need to perform any calculations, it is inbuild in tableau. We only need to drag the appropriate field to get insight into the data.
Look at the below image to get profit made each year by applying a discount.
Observing the above example we can understand that if we start visualizing data, we will get random plots. Trend lines help us to plot the data with the fitting best curve or straight lines.
One number field should be present on columns shelf and one numeric field on the shelf.
Trend lines provide details of each plotting.
a) Select the trend line and click on describe trend line.
b) We will get below the image when we click on the describe trend line.
- To estimate the linear relationship, linear trend lines are the best example. They have the following form of the equation. Y= b0+b1X
- When the rate of change increases or decreases between variables, we can use the logarithmic trend line. In the above example, we can observe how the rate of change (discount) affected.
- When the rate of change increases rapidly between variables, we can use the exponential trend line. In the above example, we can see how profit changes for each region.
- Curve lines are nothing but the polynomial trend line when the rate of change is fluctuating.
- Power trend line uses the natural log for transforming variables, it does not accept value less than zero because logarithm is not made for zero value. In the above example, we can observe that.
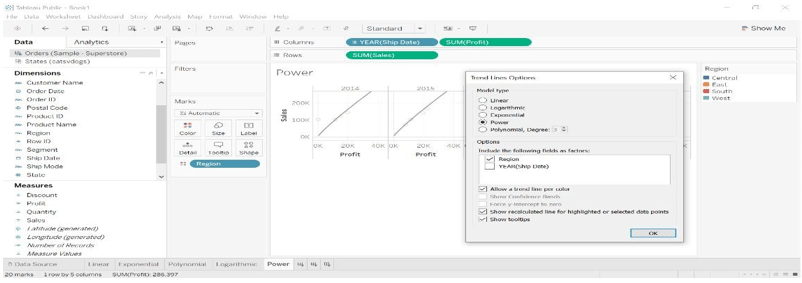
Edit Trend Lines
Let us see how pre and post editing in trend line works.
- Click on the trend line.
- Select the edit trend line. A new dialog box will open.
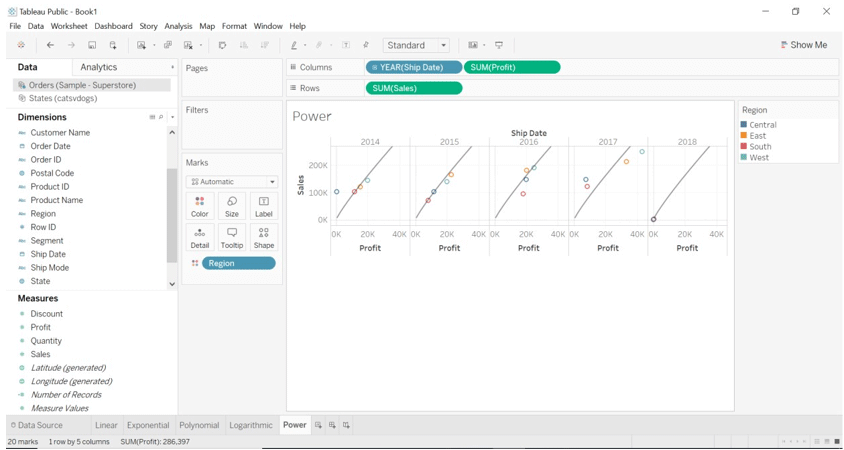
- We can edit it as we want, we have selected Region only. The graph will change.
Before editing
After Editing
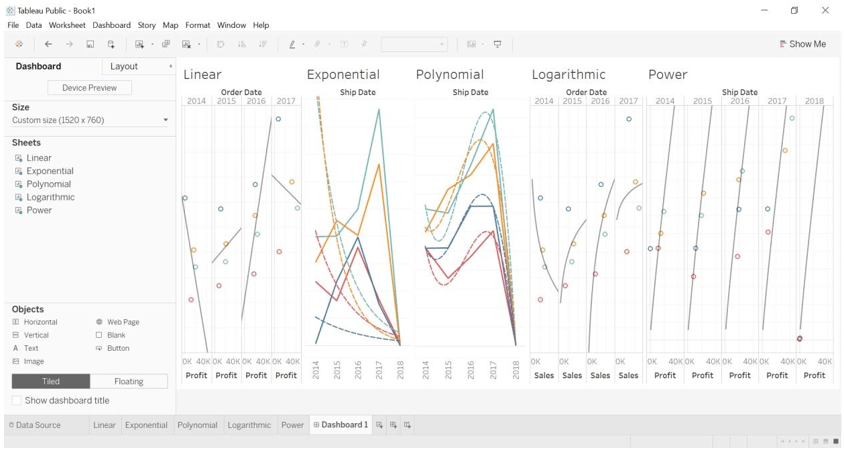
DashBoard
We have created a dashboard with all types of linear models. We have unhide some of the header files. Drag and Drop all the worksheets into the dashboard and visualize it as you want.
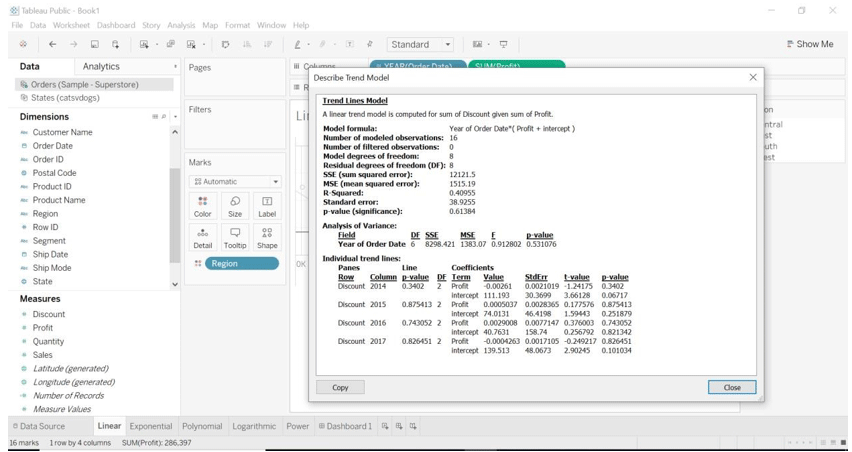
Describe Trend Model
This feature of tableau will show us how the formula is calculated for the model.
- Click on the trend line.
- Select describe trend line. You will see the below image.
Conclusion
We have learned what trend lines are, how to use it and when to use which trend line model.
If a person is not familiar with math i.e. statistics, that person does not need to worry about how the trend line is calculated or how the formula is applied. We only need to know which data field we want to do analysis with.
Recommended Articles
This is a guide to Trend Lines in Tableau. Here we discuss steps for setting up a trend line in tableau and how trend line editing works in both pre and post. You may also look at the following article to learn more –
