EDUCBA

EDUCBA

MENUMENU
  • Free Tutorials
  • Free Courses
  • Certification Courses
  • 360+ Courses All in One Bundle
  • Login
Home Data Science Data Science Tutorials Tableau Tutorial How to Use Tableau?
Secondary Sidebar
Tableau Tutorial
  • Basic
    • What is Tableau
    • What is Tableau Dashboard
    • What is Tableau Server
    • Uses of Tableau
    • Tableau Versions
    • Tableau Architecture
    • Is Tableau Free
    • Tableau New Features
    • How To Install Tableau
    • How to Use Tableau?
    • Install Tableau Server
    • Tableau Commands
  • Charts
    • Tableau Charts
    • Tableau Bar Chart
    • Tableau Chart Types
    • Donut Chart in Tableau
    • Tableau Gauge Chart
    • Funnel Chart in Tableau
    • Gantt Chart in Tableau
    • Bubble Chart in Tableau
    • Pareto Chart in Tableau
    • Sankey Chart In Tableau
    • Stacked Bar Chart in Tableau
    • Tableau Bullet Chart
    • Waterfall Chart in Tableau
    • Line Chart in Tableau
    • Heat Map in Tableau
    • Histogram in Tableau
    • CrossTab in Tableau
    • Treemap in Tableau
    • Trend Lines in Tableau
    • Tableau Reference Lines
    • Tableau Dual Axis
    • Legend in Tableau
    • Pie Chart in Tableau
    • Tableau Storyline
  • Statement
    • Tableau IF Statement
    • Case Statement in Tableau
  • Functions
    • Tableau Functions
    • Tableau String Functions
    • Concatenate in Tableau
    • Rank Function in Tableau
    • Tableau Aggregate Functions
    • Window Sum Tableau
    • LOD Expressions in Tableau
    • LOOKUP Function in Tableau
    • Tableau Fixed Function
    • Tableau Count Distinct
    • Tableau Window Functions
  • Sort/Filters
    • Sorting in Tableau
    • Filters in Tableau
    • Types of Filters in Tableau
    • Tableau Action Filter
    • Context Filter in Tableau
    • Tableau Parameter Filter
    • Adding Filters in Tableau Dashboard
    • Tableau Context Filter
  • Tableau Dashboard
    • Dashboard in Tableau
    • Tableau Dashboard Examples
    • Tableau Dashboard Creation
    • Tableau Dashboard Design
    • Tableau Workbook
  • Advanced
    • Tableau Bins
    • Tableau 3D
    • Tableau Export to Excel
    • Tableau Reporting
    • Tableau Reader
    • Tableau Map
    • Tableau Viewer
    • Tableau Prep Builder
    • Tableau Bridge
    • Tableau Tooltip
    • Tableau Hyper
    • Tableau Zen Master
    • Tableau Union
    • Tableau Templates
    • Tableau Alerts
    • Tableau Reporting Tool
    • Conditional Formatting in Tableau
    • Tableau Web Data Connector
    • Tableau BI Tool
    • Data Blending in Tableau
    • Parameters in Tableau
    • Tableau Data Sets
    • Creating Set in Tableau
    • Tableau Drill Down
    • Tableau Dynamic Parameters
    • Tableau Table Calculation
    • Tableau Visualization
    • Tableau Joins
    • Pivot in Tableau
    • Data Visualization With Tableau
    • Forecast in Tableau
    • Map Layers in Tableau
    • Group in Tableau
    • Tableau Group by
    • Hierarchy in Tableau
    • Sets in Tableau
    • How to create a Set in Tableau
    • Tableau Order of Operations
    • Tableau User Group
    • Tableau Calculated Field
    • Custom SQL in Tableau
  • Interview Questions
    • Tableau Interview Questions

Related Courses

Tableau Certification Course

Business Intelligence Courses

Data Visualization Courses

How to Use Tableau?

By Priya PedamkarPriya Pedamkar

How to Use Tableau

Introduction to Use Tableau

Tableau is the data visualization tool created by Tableau software. Before understanding tableau, we should know what data visualization means. As we can see around us, data is rapidly generating. It is not always easy to understand data in numbers. when we get the picture of the numbers it becomes easy to understand data. We, humans, are good at visualization (mental image of something). Visualization of data means having graphical or Pictorial representation of data or information. For visualization, we can use visual elements like graphs, charts or maps.

  1. Tableau is the tool that understands data, use visual elements and represents data or information to the user.
  2. Connect with various types of data sources like excel file, MySQL, google spreadsheets, etc.
  3. It finds the insight of the data like patterns, trends.
  4. Convert a large amount of data into understandable data.

Products Tableau Offers

  1. Tableau Desktop
  2. Tableau Server
  3. Tableau Online
  4. Tableau Reader
  5. Tableau Public

How does Tableau Work?

  • Tableau connects to data sources, extract data into sources and make visualization of the data.
  • There are two types of data extraction- 1) Live 2) Extract.
  • Live data connectivity is about extract data lively (online), an analyst will work on data and share a dashboard with the user. Users can read the data using the tableau reader.
  • Data extraction can be done from Tableau Desktop (offline) and it is published on Tableau Server. Users can access data using the Tableau server from any location.

Benefits of Tableau

  1. Create an Interactive Dashboard
  2. Handle Large Amount of Data like Bigdata
  3. Easy to Implement
  4. Scheduling Report
  5. Mobile Support
  6. Easy to Learn

How to Use Tableau?

There is a procedure to use tableau, we will learn from scratch.

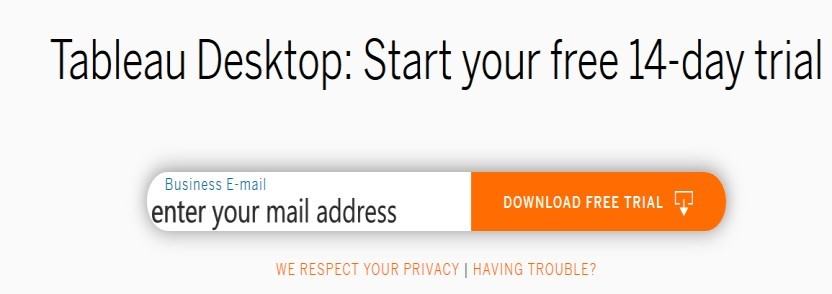
Step 1: Download Tableau Desktop or Public from https://www.tableau.com.

download tableau

Start Your Free Data Science Course

Hadoop, Data Science, Statistics & others

Step 2: We can use the desktop product for 14 days (free trial), after that we have to pay for the use of the product.

Step 3: Users should download, install and save Tableau Desktop or Public on. Users should register themselves on the website for saving visualization. Workbooks are saved with(.twbx) extension.

tableau desktop trail
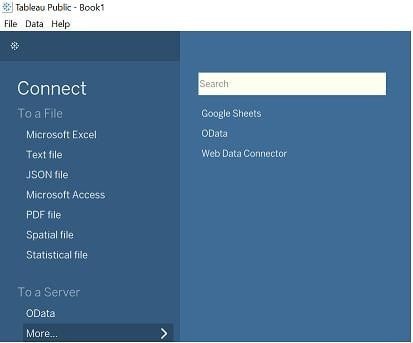
Step 4: Users can view the screen given below. Users can connect to file like excel, pdf, text, etc. Users can connect to the server. When we click on more data sources windows open.

tableau file opened

Step 5: Click on File to New, the Workspace will Open.

open on new workspace

Note: Data Source: File you have extracted can be either offline or online given with some rows and columns, tableau can have a maximum of 32.

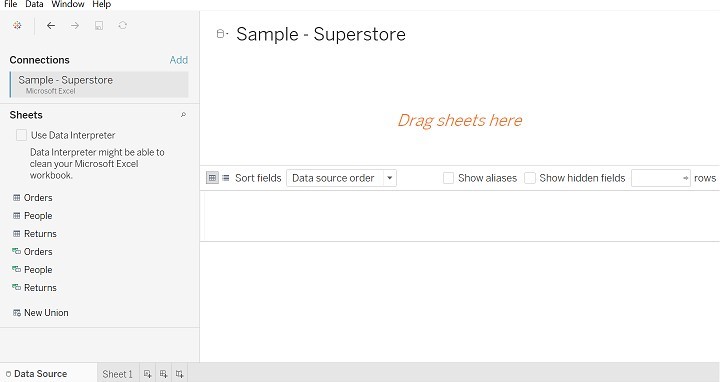
Step 6: Click on File. Open to Excel file (example purpose).

  • Data source window as below. Look at the Connections.
  • We have open Superstore Excel file, where order, people, return Table.
  • Drag the sheet given on the left side to “Drag Sheet Here”.
  • Data source order, we can arrange data in ascending or descending order.

open super store excel file

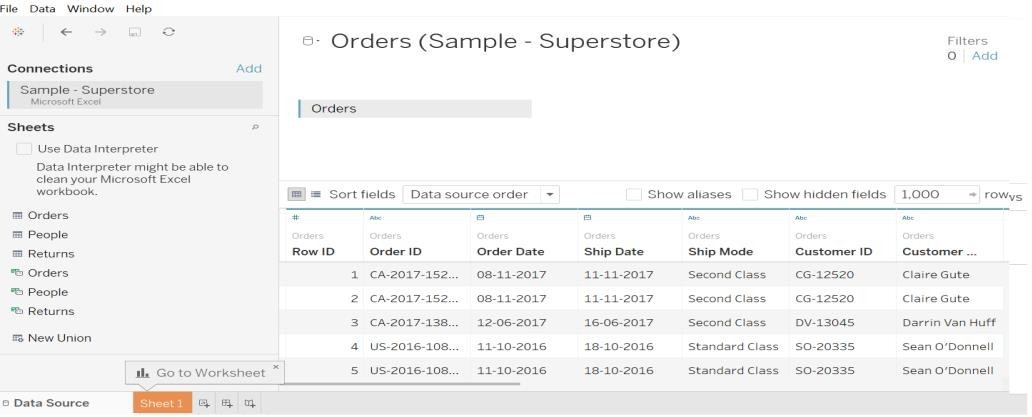
Step 7: After dragging the order table(Image Shown Below).

  • In Connection, we can see the database name.
  • Have a look at the Data Source window.
  • Look at symbol like #, Abc.
  • Right-click on the system you will get an option like rename, hide,  etc.
  • Rename option is used to rename the field name, for example, we can rename Row ID to Row ID1.
  • The hide option is used to hide the column.

after drag data

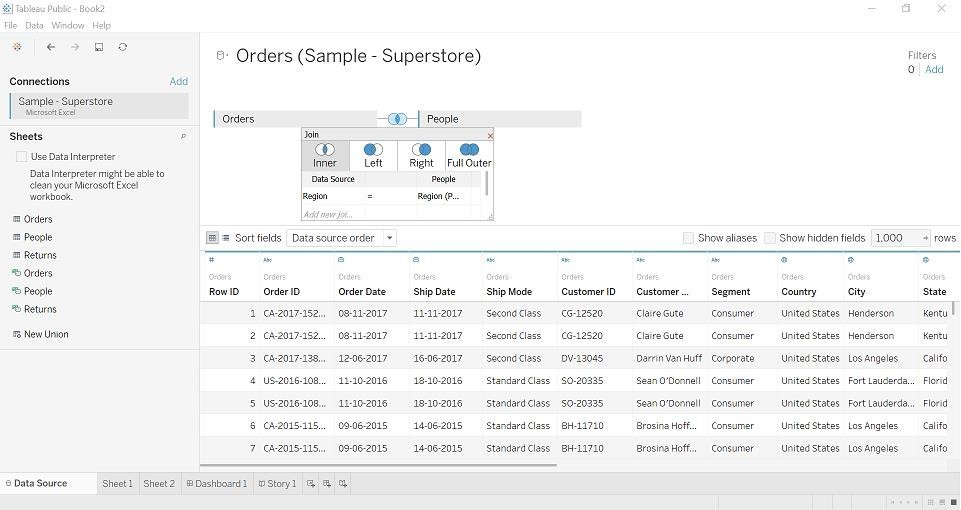
Step 8: We can perform joins between two tables. Joins type Inner, Full Outer, Left, and Right.

join two tables in tableau

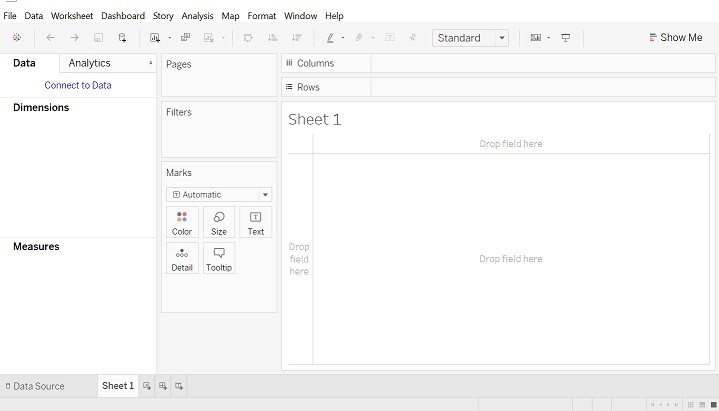
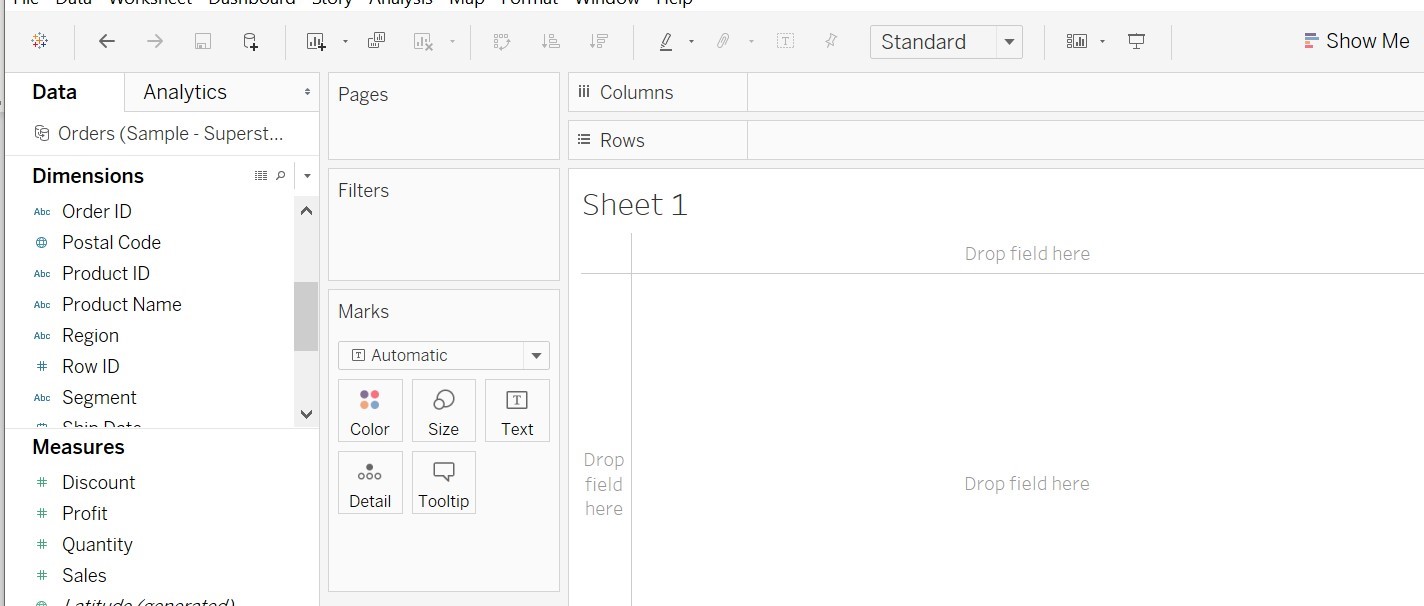
Step 9: Go to sheet 1, here can start visualization with our data.

  • Dimensions: It is qualitative data, in the above example, we can Order ID, Region, Row ID, etc. This information about values quality of data.
  • Measures: It is about the quantity of data. In the above example, we can see the value like Discount, Profit, Sales, and quantity.
  • Filters: It is used to select the data as per requirement (filter by value).
  • Show Me: This option will show graphs as per values (measures and dimensions) retrieved from the table.

visualiting data in tableau

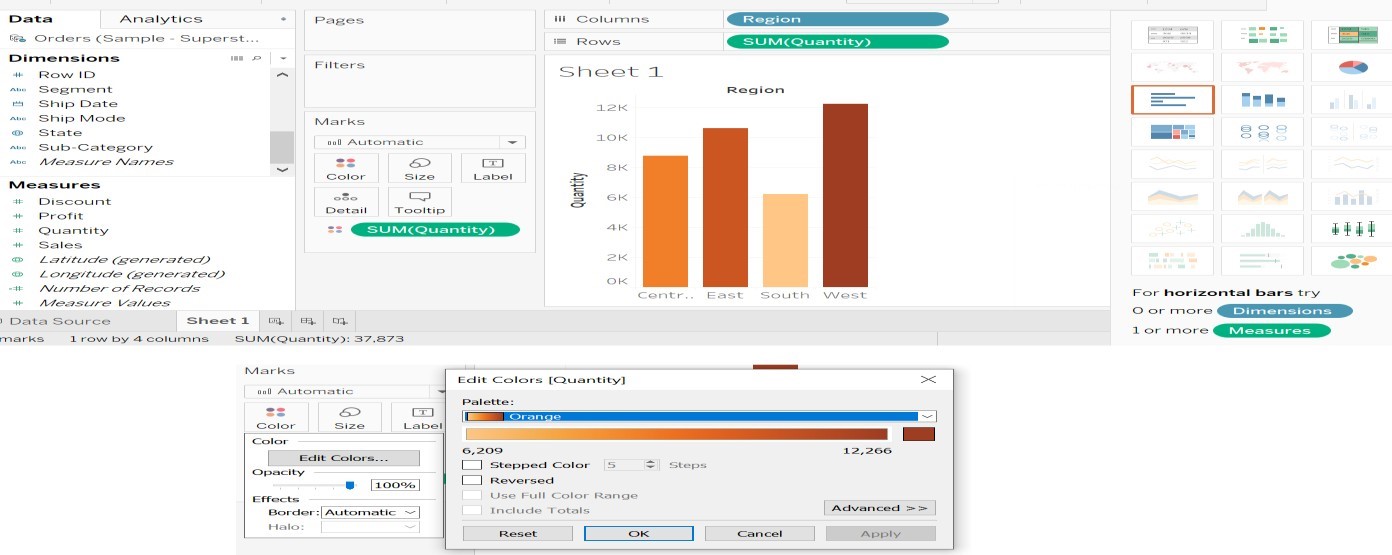
Step 10: We will drag values from dimension and measure and make a visualization.

  • We have dragged Region onto columns and quantity on to look at the quantity, by default calculated as SUM.
  • We can change the name of the sheet, click on sheet->edit sheet window will open.
  • We can see color changes as per quantity because we have dragged quantity into color.
  • Click Color. Edit Color, Palette, select color then Apply Ok.

drag reagion quantity in tableau

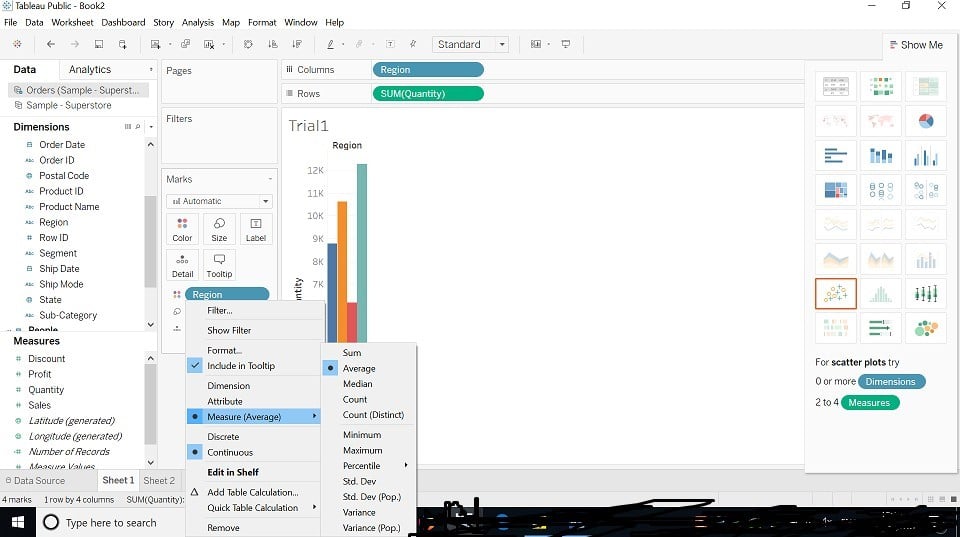
Step 11: We can Change SUM to Average, Median, (If needed to change calculation).

change sum average

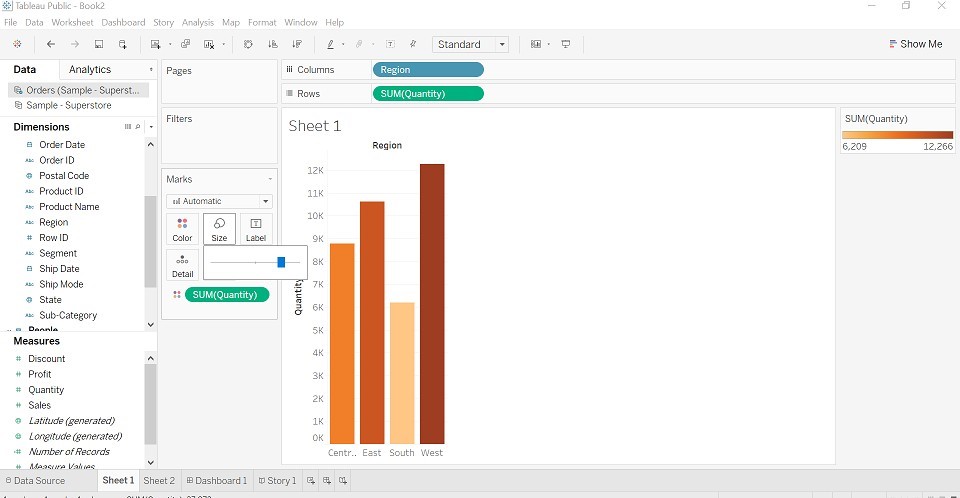
Step 12: We can change the size of the graph. (Image Shown Below). Click on size ->adjust size as per your wish.

changing graph images

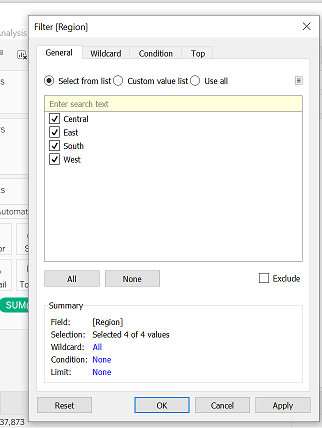
Step 13: We will have a look at “Filter”. Drag region field into the filter, we can filter by region wise. (Image Shown Below)

We can see 4 options given below.

  • General:  Name of the region is shown, we can select one or two regions or two regions or none.
  • Wildcard: Contains, starts, ends with options are available.
  • Condition: Max or Min by field.
  • Top: Top or Bottom by field.

filter in tableau

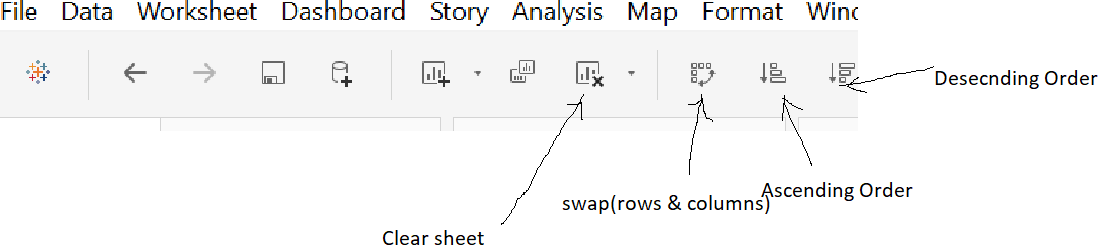
Step 14: Shortcut keys to play with data.

  • We can swap values with rows and columns.
  • Ascending & Descending Order- Arrange numbers.

short key of the data

Step 15: Tableau Dashboard

  • It contains more than one worksheet. We can drag sheets into it and make an interactive dashboard.
  • We can edit the dashboard title.
  • Select Show Dashboard Title->Right click on title->edit title->rename title.
  • Select color, size as per requirement you want to design it.

tableau dashboard images

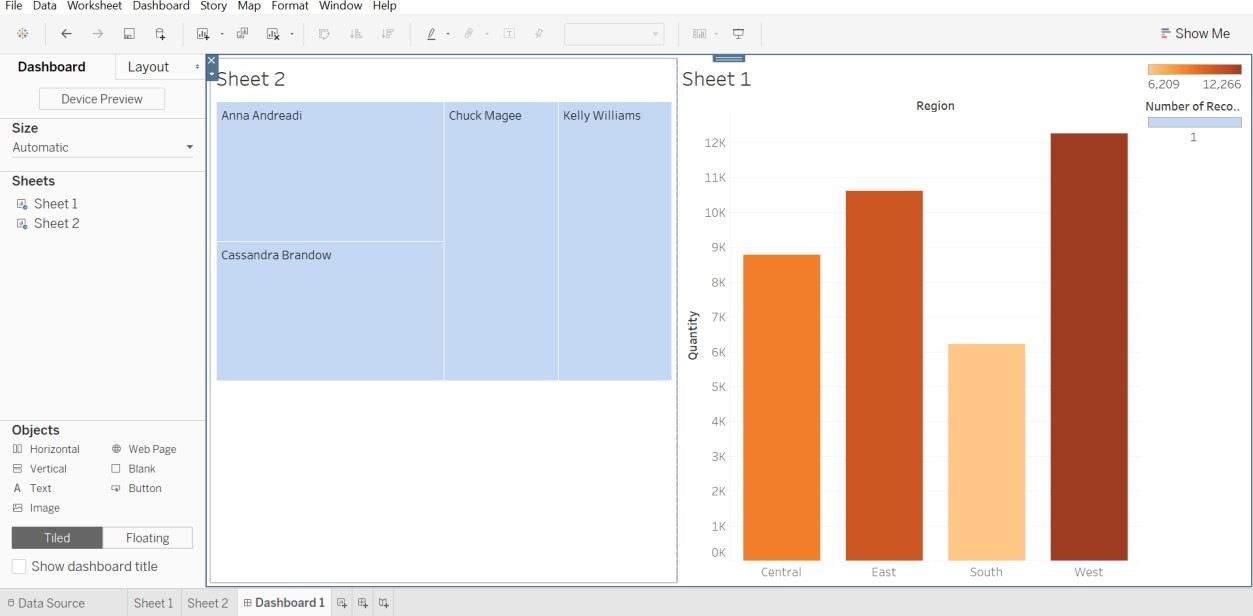
Step 16: In the above example, we can see that two sheets (sheet 1, Sheet2) are dragged into the dashboard. On the right side, we can see two bars (one for the sum of sales and the other is for the number of records), which belongs to sheet1 and sheet2.

Conclusion

We don’t need to have any technical skills to learn Tableau. We should have the enthusiasm to learn the tool. It is all about playing with data you have, make it more readable to the human in a picture-perfect way. If we use every feature that the tool offers, data would look more interactive.

Recommended Articles

This is a guide to How to Use Tableau? Here we discuss how does Tableau works, its benefits, Steps to use Tableau. You can also go through our given articles to learn more-

  1. What is Tableau?
  2. How To Install Tableau
  3. Tableau Alternatives
  4. Tableau Date Functions
Popular Course in this category
Tableau Training (8 Courses, 8+ Projects)
  8 Online Courses |  8 Hands-on Projects |  55+ Hours |  Verifiable Certificate of Completion
4.5
Price

View Course

Related Courses

Business Intelligence Training (12 Courses, 6+ Projects)4.9
Data Visualization Training (15 Courses, 5+ Projects)4.8
0 Shares
Share
Tweet
Share
Primary Sidebar
Footer
About Us
  • Blog
  • Who is EDUCBA?
  • Sign Up
  • Live Classes
  • Corporate Training
  • Certificate from Top Institutions
  • Contact Us
  • Verifiable Certificate
  • Reviews
  • Terms and Conditions
  • Privacy Policy
  •  
Apps
  • iPhone & iPad
  • Android
Resources
  • Free Courses
  • Database Management
  • Machine Learning
  • All Tutorials
Certification Courses
  • All Courses
  • Data Science Course - All in One Bundle
  • Machine Learning Course
  • Hadoop Certification Training
  • Cloud Computing Training Course
  • R Programming Course
  • AWS Training Course
  • SAS Training Course

ISO 10004:2018 & ISO 9001:2015 Certified

© 2022 - EDUCBA. ALL RIGHTS RESERVED. THE CERTIFICATION NAMES ARE THE TRADEMARKS OF THEIR RESPECTIVE OWNERS.

EDUCBA
Free Data Science Course

SPSS, Data visualization with Python, Matplotlib Library, Seaborn Package

*Please provide your correct email id. Login details for this Free course will be emailed to you

By signing up, you agree to our Terms of Use and Privacy Policy.

EDUCBA Login

Forgot Password?

By signing up, you agree to our Terms of Use and Privacy Policy.

EDUCBA
Free Data Science Course

Hadoop, Data Science, Statistics & others

*Please provide your correct email id. Login details for this Free course will be emailed to you

By signing up, you agree to our Terms of Use and Privacy Policy.

EDUCBA

*Please provide your correct email id. Login details for this Free course will be emailed to you

By signing up, you agree to our Terms of Use and Privacy Policy.

Let’s Get Started

By signing up, you agree to our Terms of Use and Privacy Policy.

This website or its third-party tools use cookies, which are necessary to its functioning and required to achieve the purposes illustrated in the cookie policy. By closing this banner, scrolling this page, clicking a link or continuing to browse otherwise, you agree to our Privacy Policy

Loading . . .
Quiz
Question:

Answer:

Quiz Result
Total QuestionsCorrect AnswersWrong AnswersPercentage

Explore 1000+ varieties of Mock tests View more