Updated March 21, 2023
Overview of Tableau Table Calculation
Tableau is one of the best BI tools in the market, and it can handle large amounts of data sets. In this article, we would see Table Calculation which simplifies various operations. In this topic, we are going to learn about Tableau Table Calculation.
Table calculations are computations applied to the values in the table. It depends on the table structure or the viz’s dimensions or the visualization level of detail. So, these calculations can be used whenever you want to extend the values present in your table or view.
An important point to remember is that the table calculations are dependent on the dimensions in the VIS level of detail. So, what exactly is this level of detail? The detail level includes all those dimensions on the shelves or the cards as indicated within the red boxes.
These are the topics that we would cover today.
- Tableau Table Calculations
- Tableau Calculation Fields
- Difference between Tableau table calculations and Tableau calculated Fields.
- Tableau Calculation Function
Tableau Table Calculations
Table Calculation comes running several types like total, percentage, total percentage, average, total average in the table, etc. These are predefined calculations and called a Tableau table calculation.
The benefits of Table Calculation
- The fastest way to calculate the values for the tables like total, average or per cent, etc.,
- It can also be saved and use as calculated fields.
- Efficient result for calculating values
Tableau Calculation Fields
Before beginning with this topic, start your Tableau desktop and download the given dataset to male this practice.
Steps to download Tableau Desktop: Click here
Download Bank Customer Dataset: Click here
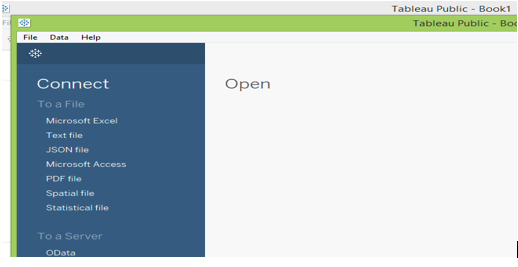
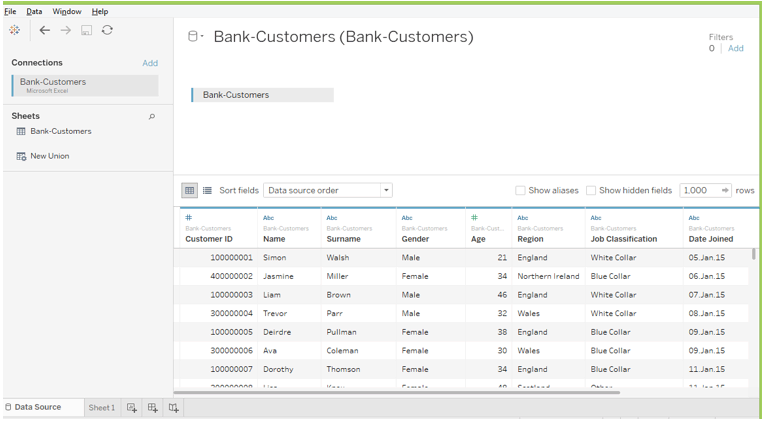
Open a new workbook in tableau desktop and connect the data sources using the .xls file dataset.
The data sources look like
Using this data source, we can create a table based on customer name and total balance.
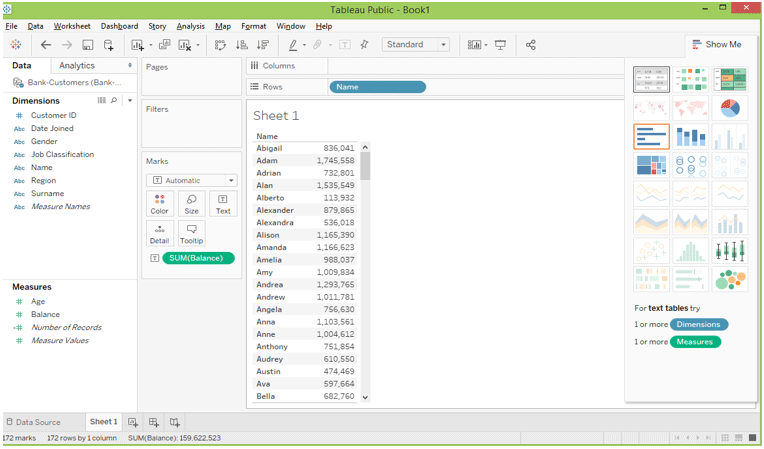
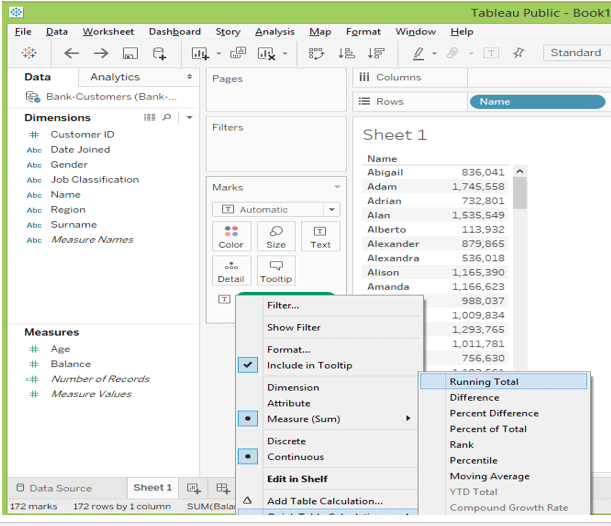
Table calculation would add the measures in the view. The easiest way to make the calculation is to explore the Quick Table Calculation option when selecting the dropdown.
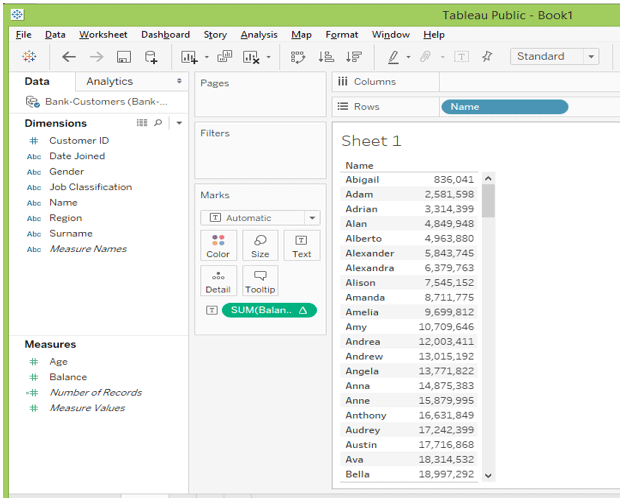
After running the total, the table will look like below.
The calculation can rely on these two types.
- Addressing field – It says the direction of the calculation.
- Partitioning fields – The data can be partition into various types and then act as a calculation.
Note
- In this example, we have seen the running total is from top to bottom based on the addressing field “name”—the calculation by default taken as the name category field.
- When we add the region into the field, it is easy to change the addressing field.
Let’s do this, drag the region in the column and click the measure table calculation again. Now we can identify the data symbol Compute using and change how we want the calculation to be computed.
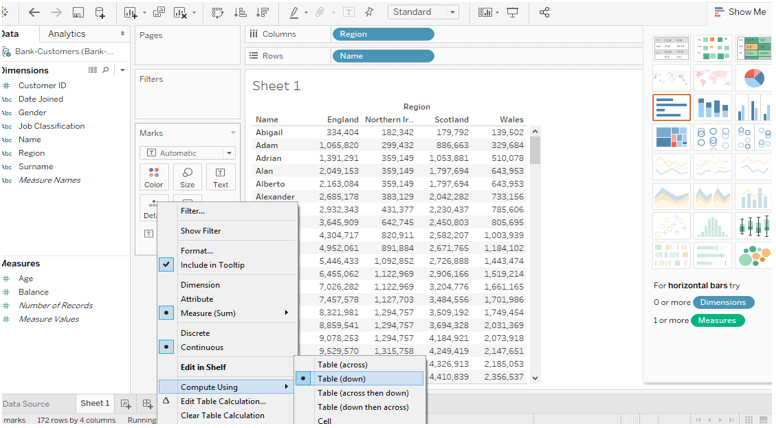
We can also change the partitioning in different ways based on the needs
Difference Between Table Calculation and Calculated Fields
Both table calculation and calculated fields are the same using the compute the result. But we will see the difference in how the computer talks place and how it can be reused in more worksheets.
1. Tableau Table Calculation
- It is created locally and lives in tableau view.
- When we say it would create as locally and can’t be reused to the data source
- If we want to reuse it, we need to save it in the pane by dragging it.
2. Tableau Calculated Field
- It will be created as a separated column in the data source.
- The source can’t be changed so that we can use the calculated field in any worksheets.
- It would be computed with the data sources and view as a new column and can be re-use.
When we compare to table calculation and calculated field, the calculation has a limited scope than the then calculated field. A calculated field can be enabled for deeper analysis.
Tableau Calculation Function
Let’s see few Tableau Calculation Functions.
Lookup()
Lookup value returns the selected target’s expression values and points to the relative offset in the current row. It will also return the NULL values if the target values don’t contain anything.
Syntax for lookup(): LOOKUP(expression,[offset])
Example: LOOKUP(SUM([BALANCE])), +1)
Index()
The index returns a value from the given array range. We take a simple example in excel by indexing A1: B12 and returning the value by using the MATCH function. In the tableau, it will partition and returns the current row value.
Example: INDEX() = 5
Last()
It will return the no. of rows in the current row with the last row’s partition.
Example: Current row index is 7 of 10 LAST() = 8
First()
It will return the no. of rows in the current row with the first row’s partition.
Example: Current row index is 7 FIRST() = -5
Previous_Value()
It will return the values from the previous row, which has been calculated. Also, return the expression when the current row is the first row in the table.
Syntax for Previous_Value(): PREVIOUS_VALUE(expression)
Example: SUM([BALANCE]) * PREVIOUS_VALUE (2)
Rank()
In the viz, we can see the rank for every row or pane in the table calculation. It will return the rank for the current partition. The NULL Value can be ignored in the rank function.
Running_Max()
It will return the maximum for the given row from the first-row partition.
Example: RUNNING_MAX (SUM[BALANCE])
Running_Min()
It will return the minimum for the given row from the first-row partition.
Example: RUNNING_MIN (SUM[BALANCE])
Running_Avg()
It will return the Average value for the given row from the first-row partition.
Example: RUNNING_AVG (SUM[BALANCE])
Running_Count()
It will return the count of value for the given row from the first-row partition.
Example: RUNNING_COUNT (SUM[BALANCE])
Running_Sum()
It will return the sum of the value for the given row from the first-row partition.
Example: RUNNING_SUM (SUM[BALANCE])
Size()
It will say the no. of rows in the partition.
Example: SIZE() = 10 , When the partition have 10 rows
Total()
It will return the total of a given row by ROW/COLUMN.
Conclusion
This article has learned what is about table calculation, calculated field difference between these two, and how to use table calculations.
Recommended Articles
This is a guide to Tableau Table Calculation. Here we discuss an overview of tableau table calculation, table calculation field, calculated field, and table calculations. You may also have a look at the following articles to learn more –
