EDUCBA

EDUCBA

MENUMENU
  • Free Tutorials
  • Free Courses
  • Certification Courses
  • 360+ Courses All in One Bundle
  • Login

Tableau Calculated Field

By Priya PedamkarPriya Pedamkar

Home » Data Science » Data Science Tutorials » Tableau Tutorial » Tableau Calculated Field

Tableau calculated field

Introduction to Tableau Calculated Field

Tableau date functions are highly useful inbuilt date functions, such as DAY, MONTH, YEAR, DATEDIFF, MAX, MIN, and, TODAY, etc. which are provided by Tableau software, and which enable the user to manipulate the data source, in the context of dates and times, as required, further allowing the user to perform various date operations on records, along with creation of complex date expressions, which facilitate in year to year, month to month or weekly analysis of data.

Syntax:

Start Your Free Data Science Course

Hadoop, Data Science, Statistics & others

Calculated field(value)

How does Tableau calculated field Works?

The calculated field will perform functions on values from other table fields or it will calculate values entered by the user. The calculated field will perform query operations during field value calculations. We can perform any calculation through calculated fields, and we can create N number of calculated fields. We need to create a calculated field, give the name to it and enter field value on which we want to perform calculations. If we take calculation field value from dimension, then the field is added to the measure or If we take calculation field from measure then the field is added to the dimension.

Examples of Tableau Calculated Field

Here are the following examples of Tableau Calculated Field mention below

Example #1

We can create calculated fields by clicking on Analysis or clicking on the bottom arrow of the dimension field. We can create a calculated field from two choices.

Tableau Calculated Field example 1

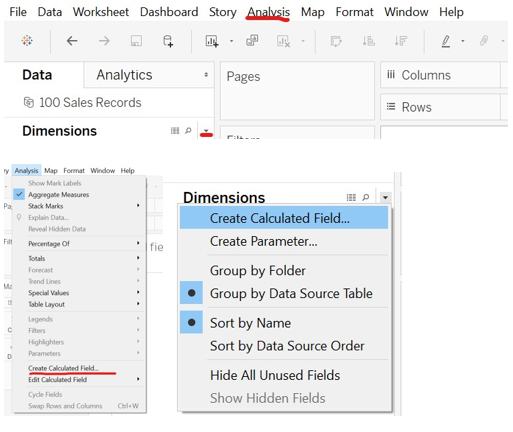
  • Go to the data source option, connect to the database file either present in the excel, text format or can connect to the live database or offline database.
  • Open the calculated field and give the name to the calculated field and edit as per calculation you want to perform.
  • We have pulled 100 sales record file, go to the sheet and rename it (as per your choice).
  • We are going to calculate Min of the unit cost of the item from order date to ship date.
  • MIN([Unit Cost]) – we have created a min named calculated field, and it is created at the measures field.
  • Drag min calculated field to Text formatting option, hip date to columns and order date to rows.
  • We can see min unit cost between order to ship date for items.

Tableau Calculated Field example 1.2

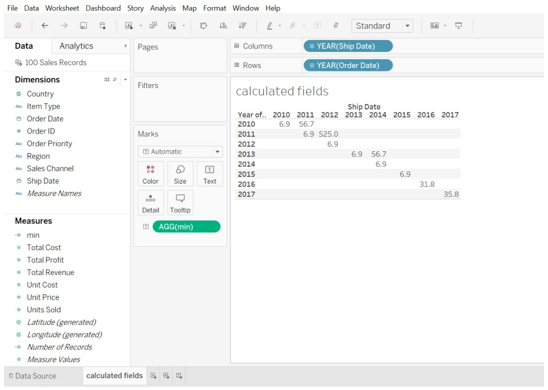
min unit cost for the 2010 year for the order to ship data is 6.9 and for 2011 (order date) to 2012 (ship date) is 525.0.

Example #2

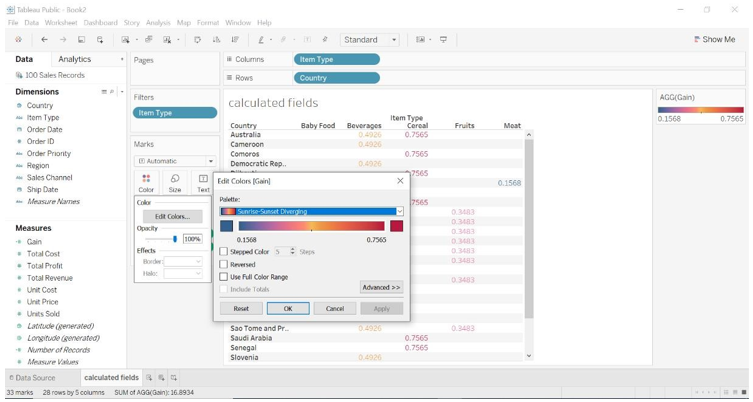
We are going to find Gain value for the item type as per each country.

  • Create calculated field name it as Gain and add a calculation for
SUM([Total Profit])/SUM([Total Cost])
  • Drag item type to columns and country to rows.
  • Drag Gain (calculated field) to the Text formatting option.
  • Drag Item type to filter option because there is multiple choice of item type, we are doing it for some 3-4 item type.
  • Drag Gain (calculated field) to color formatting option, will get more visualized data.

Tableau Calculated Field example 2

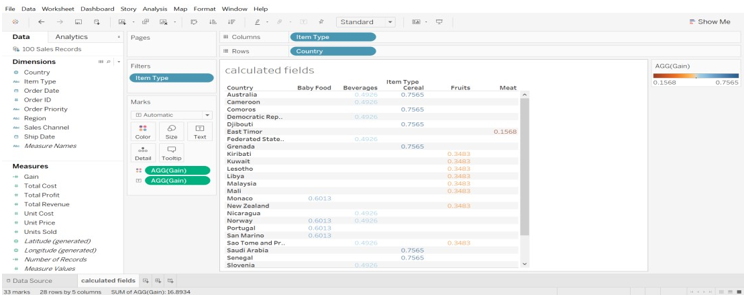
  • We can see in the above image different color is present for the item type with gain. For example – Fruits having orange color and Meat having a brown color. We can edit the default color filter (click on color->select edit color->choose the color you want).
  • We can edit color, we have selected sunrise-sunset diverging color plate. Value changes as per the color changes in the visualization. Please refer to the below image for editing color.

Tableau Calculated Field example 2.2

Example #3

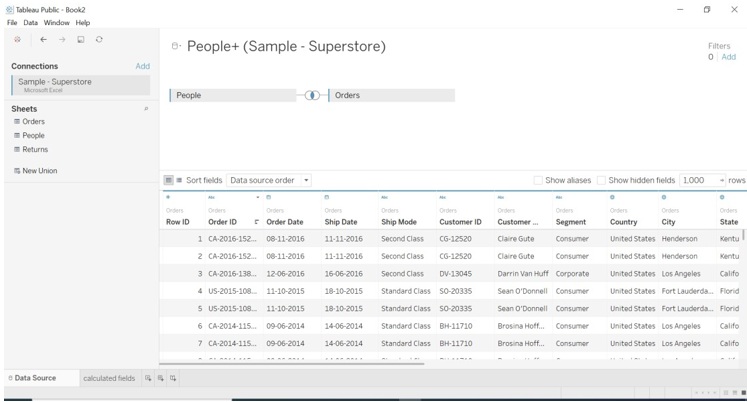
 We have pulled the sample superstore database; inner join is performed for people and order table sheet.

example 3

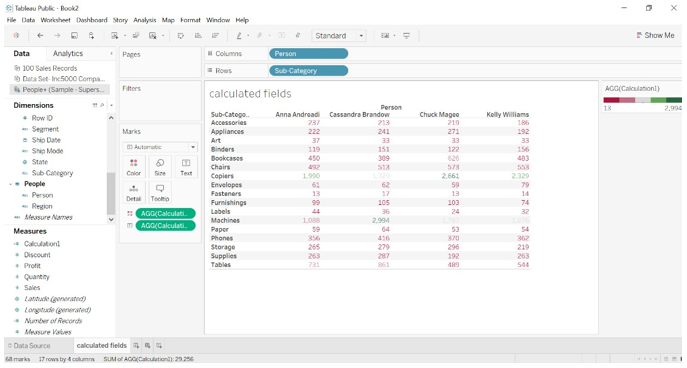
  • We have created a calculated field for the AVG function. Average sales count for the person and the sub-category (fields from the two different databases).
  • AVG([Sales]) – data inside the calculated1 field created.
  • Drag person field to columns and sub-category to rows.
  • Drag the calculated1 field to the color and text formatting option.
  • Edit the color for the average range of sales, it will be easy to understand the result more effectively.
  • For example – Average sales for a person name Anna andreadi with sub-category as art is 37. For machine average count is 1088 (the color is also changed).

example 3.2

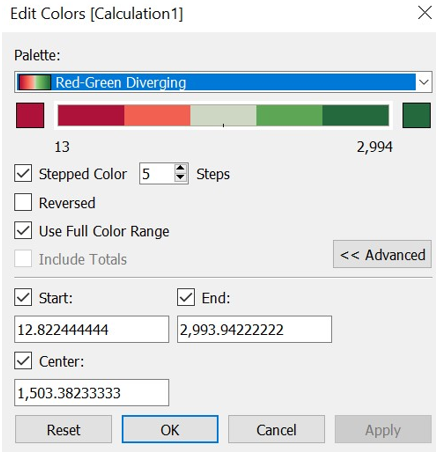
  • We can observe in the above image we have selected start, end and center value. We can edit the value as per our choice.

example 3.3

Example #4

We have created a calculated field with discount measure, the calculated field has resulted in the dimension.

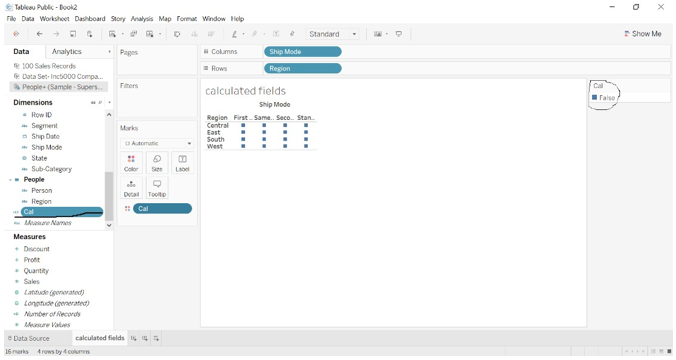
  • we have created a calculated field for the ISNULL function, if the value dimension or measure field contains no values, the output of ISNULL is shown as True.
  • If the value dimension or measure field contains values, the output of ISNULL is shown as False.
  • Syntax – ISNULL([Discount])
  • Drag ship mode to columns and region to rows.
  • Drag Cal (calculated field created) to color.
  • The result is shown as False because the discount field contains values, it is not empty.

Tableau Calculated Field example 4

Conclusion

We have learned tableau calculation fields, the reason to use calculated fields. Steps needed to create and edit calculated fields. When we are with calculations, fields are the best way to work with. We have multiple options available for the calculations like min, max, sum, ratio, etc.

Tableau is providing an error feature to validate the syntax we are using for the calculations. Measure and Dimension values are provided automatically for the calculation fields.

Recommended Articles

This is a guide to Tableau Calculated Field. Here we discuss how does Tableau calculated field Work along with the examples. You may also have a look at the following articles to learn more –

  1. Legend in Tableau
  2. Guide to Date Functions in Hive
  3. Learn the PostgreSQL Date Functions
  4. Complete Guide to Window Sum Tableau
  5. Tableau Order of Operations
  6. Tableau User Group | Examples

Tableau Training (4 Courses, 6+ Projects)

4 Online Courses

6 Hands-on Projects

39+ Hours

Verifiable Certificate of Completion

Lifetime Access

Learn More

0 Shares
Share
Tweet
Share
Primary Sidebar
Tableau Tutorial
  • Advanced
    • Tableau Reporting
    • Tableau Reporting Tool
    • Conditional Formatting in Tableau
    • Data Blending in Tableau
    • Parameters in Tableau
    • Tableau Data Sets
    • Tableau Drill Down
    • Tableau Dynamic Parameters
    • Tableau Table Calculation
    • Tableau Visualization
    • Tableau Joins
    • Pivot in Tableau
    • Data Visualization With Tableau
    • Forecast in Tableau
    • Map Layers in Tableau
    • Group in Tableau
    • Tableau Group by
    • Hierarchy in Tableau
    • Sets in Tableau
    • How to create a Set in Tableau
    • Tableau Order of Operations
    • Tableau User Group
    • Tableau Calculated Field
    • Custom SQL in Tableau
  • Basic
    • What is Tableau
    • What is Tableau Dashboard
    • What is Tableau Server
    • Uses of Tableau
    • Tableau Versions
    • Tableau Architecture
    • Is Tableau Free
    • Tableau New Features
    • How To Install Tableau
    • How to Use Tableau?
    • Install Tableau Server
    • Tableau Commands
  • Charts
    • Tableau Charts
    • Tableau Chart Types
    • Donut Chart in Tableau
    • Funnel Chart in Tableau
    • Gantt Chart in Tableau
    • Bubble Chart in Tableau
    • Pareto Chart in Tableau
    • Sankey Chart In Tableau
    • Stacked Bar Chart in Tableau
    • Tableau Bullet Chart
    • Waterfall Chart in Tableau
    • Line Chart in Tableau
    • Heat Map in Tableau
    • Histogram in Tableau
    • CrossTab in Tableau
    • Treemap in Tableau
    • Trend Lines in Tableau
    • Tableau Reference Lines
    • Tableau Dual Axis
    • Legend in Tableau
    • Pie Chart in Tableau
    • Tableau Storyline
  • Statement
    • Tableau IF Statement
    • Case Statement in Tableau
  • Functions
    • Tableau Functions
    • Tableau String Functions
    • Concatenate in Tableau
    • Rank Function in Tableau
    • Tableau Aggregate Functions
    • Tableau Date Functions
    • Window Sum Tableau
    • LOD Expressions in Tableau
    • LOOKUP Function in Tableau
    • Tableau Fixed Function
    • Tableau Count Distinct
    • Tableau Window Functions
  • Sort/Filters
    • Sorting in Tableau
    • Filters in Tableau
    • Types of Filters in Tableau
    • Tableau Action Filter
    • Context Filter in Tableau
    • Tableau Parameter Filter
    • Adding Filters in Tableau Dashboard
    • Tableau Context Filter
  • Tableau Dashboard
    • Dashboard in Tableau
    • Tableau Dashboard Creation
    • Tableau Dashboard Design
    • Tableau Workbook
  • Interview Questions
    • Tableau Interview Questions

Related Courses

Tableau Certification Course

Business Intelligence Courses

Data Visualization Courses

Footer
About Us
  • Blog
  • Who is EDUCBA?
  • Sign Up
  • Corporate Training
  • Certificate from Top Institutions
  • Contact Us
  • Verifiable Certificate
  • Reviews
  • Terms and Conditions
  • Privacy Policy
  •  
Apps
  • iPhone & iPad
  • Android
Resources
  • Free Courses
  • Database Management
  • Machine Learning
  • All Tutorials
Certification Courses
  • All Courses
  • Data Science Course - All in One Bundle
  • Machine Learning Course
  • Hadoop Certification Training
  • Cloud Computing Training Course
  • R Programming Course
  • AWS Training Course
  • SAS Training Course

© 2020 - EDUCBA. ALL RIGHTS RESERVED. THE CERTIFICATION NAMES ARE THE TRADEMARKS OF THEIR RESPECTIVE OWNERS.

EDUCBA Login

Forgot Password?

EDUCBA
Free Data Science Course

Hadoop, Data Science, Statistics & others

*Please provide your correct email id. Login details for this Free course will be emailed to you
Book Your One Instructor : One Learner Free Class

Let’s Get Started

This website or its third-party tools use cookies, which are necessary to its functioning and required to achieve the purposes illustrated in the cookie policy. By closing this banner, scrolling this page, clicking a link or continuing to browse otherwise, you agree to our Privacy Policy

EDUCBA

*Please provide your correct email id. Login details for this Free course will be emailed to you
EDUCBA
Free Data Science Course

Hadoop, Data Science, Statistics & others

*Please provide your correct email id. Login details for this Free course will be emailed to you

Special Offer - Tableau Training (4 Courses, 6+ Projects) Learn More