Updated March 24, 2023
Introduction to Sets in Tableau
In Tableau, when we intend to group certain dimension values in the context of a particular problem, we use the concept of Sets. The concept of Sets allows us to drive analysis by creating meaningful groups that actually conveys us some actionable insights. Some of the common examples are: Sales professionals want to identify which are the best and the worst-performing regions. Supply chain teams in retail are always concerned about and need to keep track of the highest and lowest selling products in order to make efficient inventory planning. So through visual analytics using sets, we can accomplish this.
How to Create and Use Sets in Tableau?
In the following section, we are going to see how sets are created in Tableau. For this demonstration, we are going to use Regional Sales dataset. It contains sales for various sales units across India. Sales Unit is an important dimension while Sales is the measure that we are going to use in our analysis.
Let us proceed to understand the step-by-step procedure to create sets in Tableau:
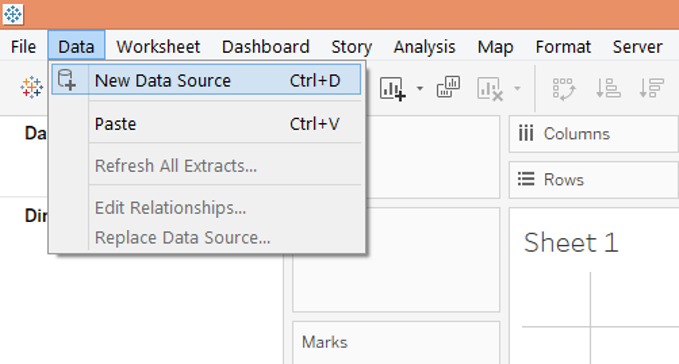
Step 1: Load the Regional Sales dataset into Tableau. For that click on “New Data Source” under the Data menu. Alternatively, click on “Connect to Data”.
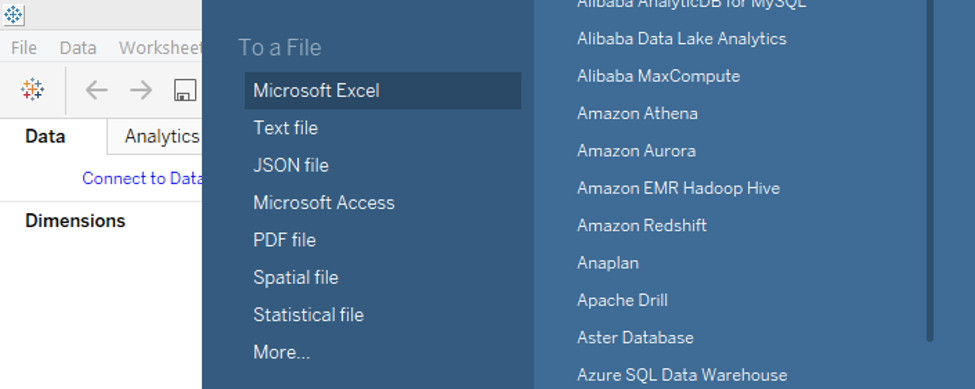
Step 2: Select the requisite data source type from the section that pops-up. In this case, it is an MS Excel file. So we selected Microsoft Excel.
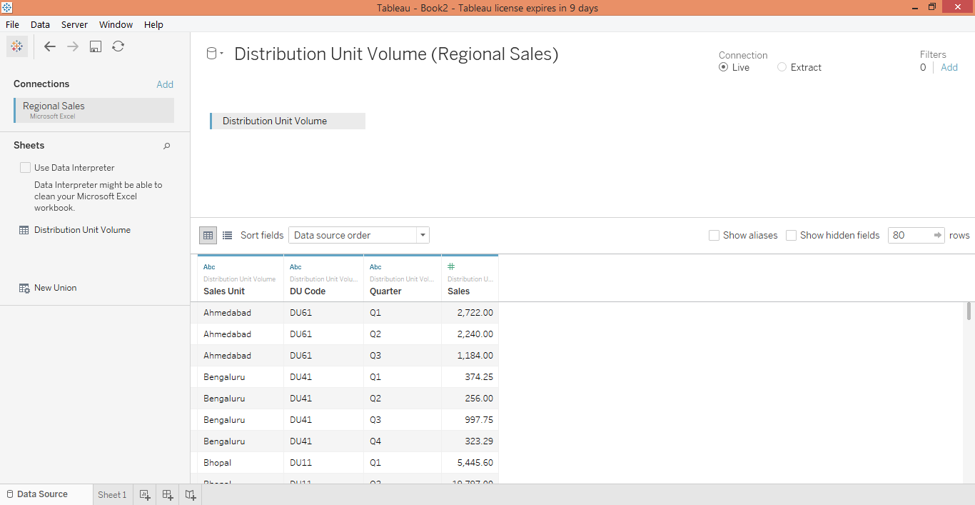
Step 3: We can see the loaded data into the “Data Source” tab. Examine the data prior to proceeding to the analysis. This is important to ensure that data is intact and doesn’t impact the analysis.
Step 4: Moving to the sheet tab, we can find the dimensions and the measures present in the requisite sections.
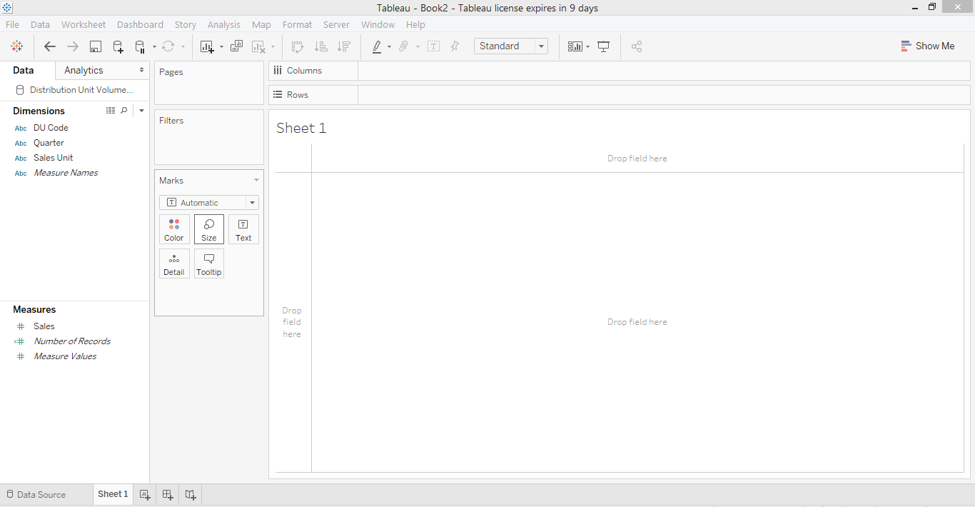
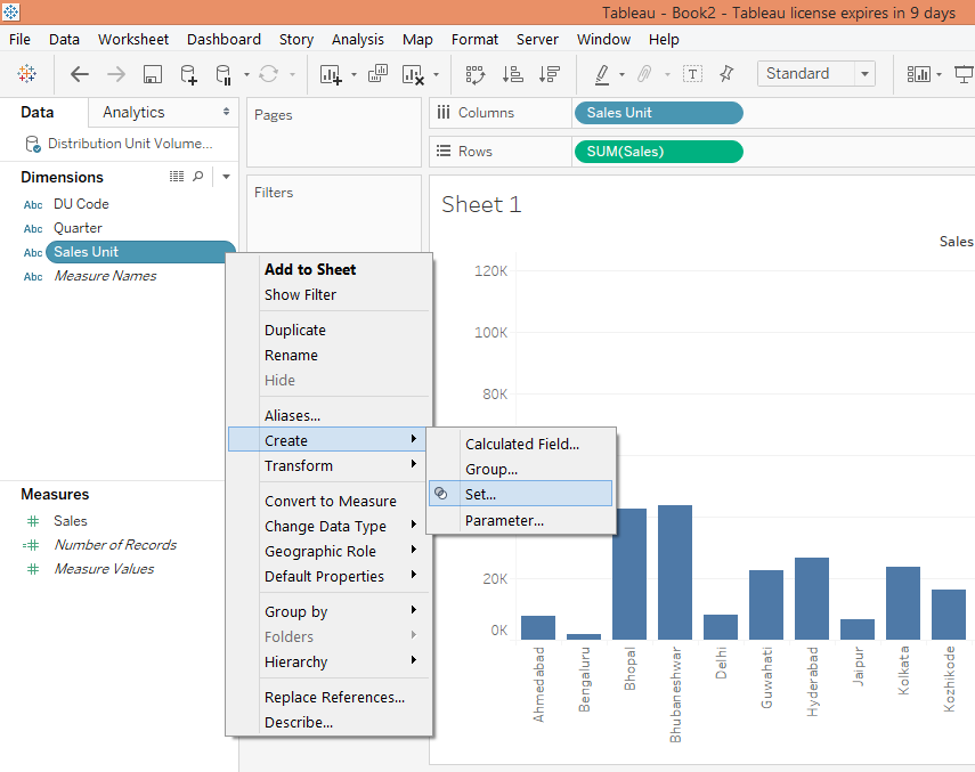
Step 5: As a first step, we brought dimensions Sales unit into the Columns region and measure Sales into Rows region. These steps generated a vertical graph as shown below.

Step 6: Now, we intend to visualize Sales Units in the West region separately. The Sales Units that belong to the West region are Ahmedabad, Mumbai, Nasik, Pune, Surat, and Rajkot. We may separate them from the Set in the analysis. So, we will create a set of these cities belonging to the West region. Let’s see how this is done.
Step 7: Click on the drop-down menu of the dimension Sales Unit. In “Create”, select “Set” and click over it. This is as illustrated in the below screenshot.
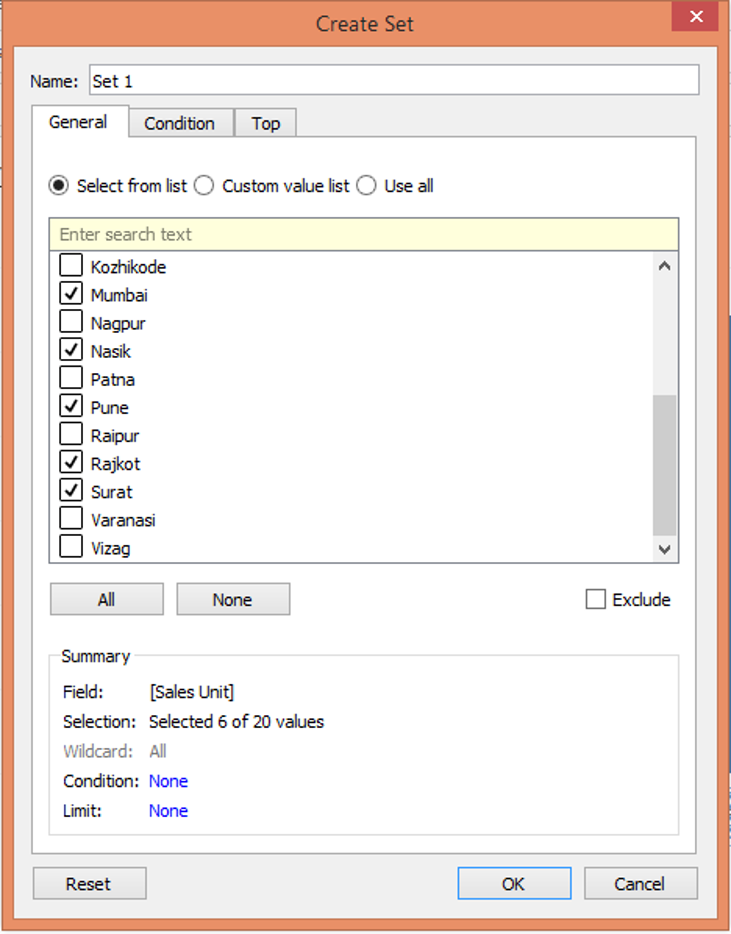
Step 8: Following the above steps generates the “Create Set” dialogue box as shown in the below screenshot. As we can see there are various options. Let’s explore them one-by-one. First, in the “General” tab, we can select the desired dimension values to form a set. We intend to have a set of cities representing the West region, so as can be seen in the dialogue box, in the “General” tab, we selected all such cities. Finally, Click on OK to generate the set.
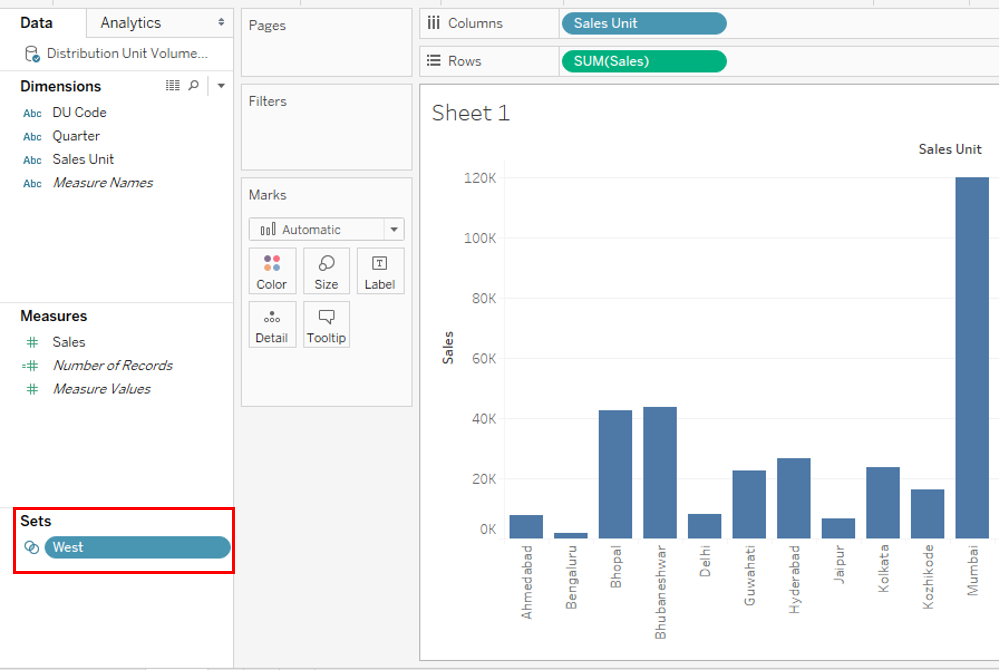
Step 9: We named the set as “West”, and it can be seen under the “Sets” section in the below screenshot.
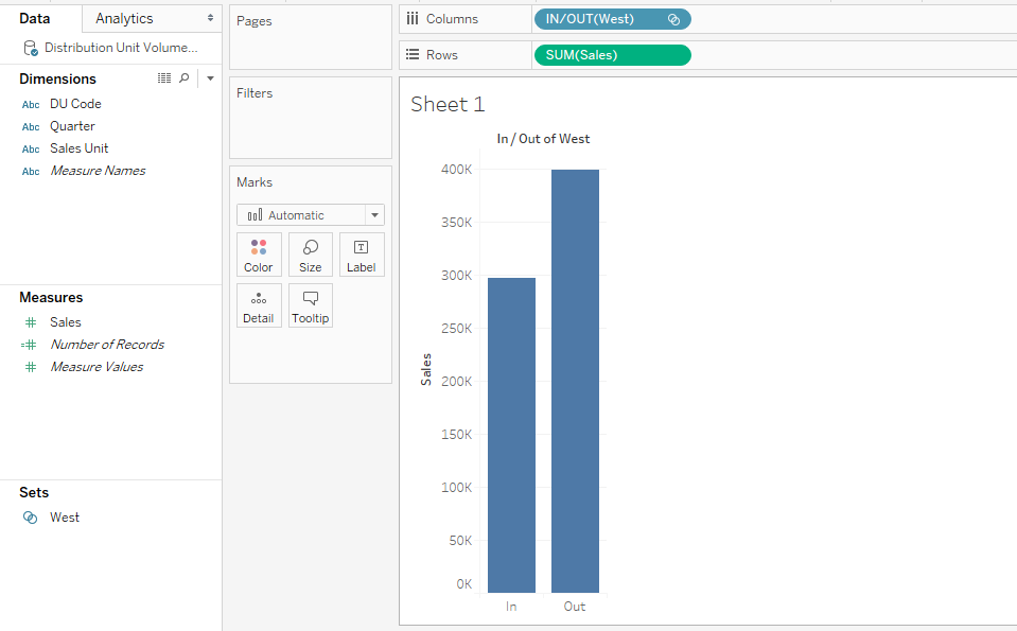
Step 10: Now, we brought the newly created set “West” into columns region. As shown in the below screenshot, the set appears in IN/OUT form. This essentially means that the set has been considered as IN while OUT represents those not in the set. This is how we can separate certain dimension values of our interest from other dimension values.
Step 11: We can make the dimension values in the set visible. For that just click on the drop-down menu of the Set variable, and click on the “Show Members in Set” option. This is as illustrated in the below screenshot.
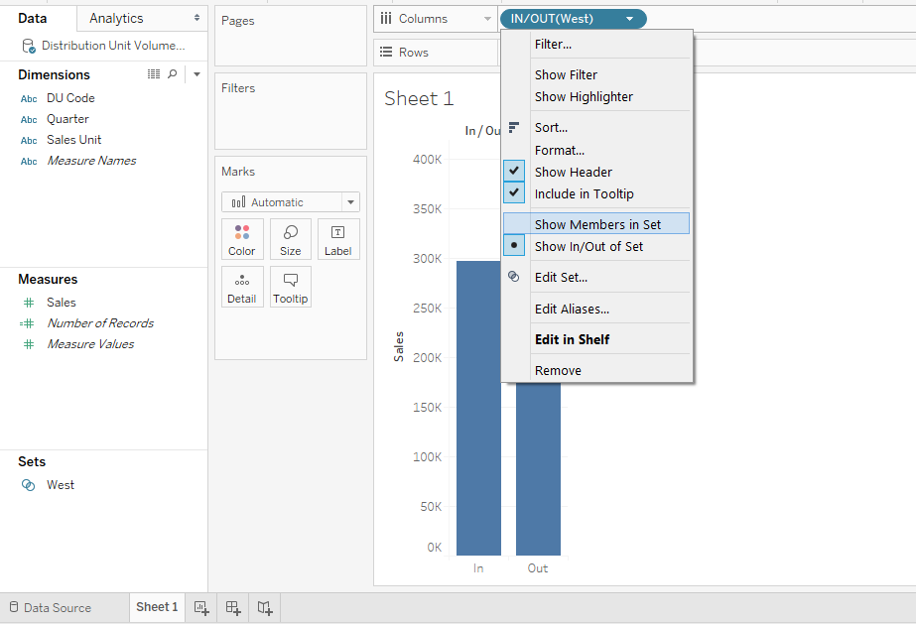
Step 12: As we can be seen in the below screenshot, now, cities in the West only appear in the visualization.

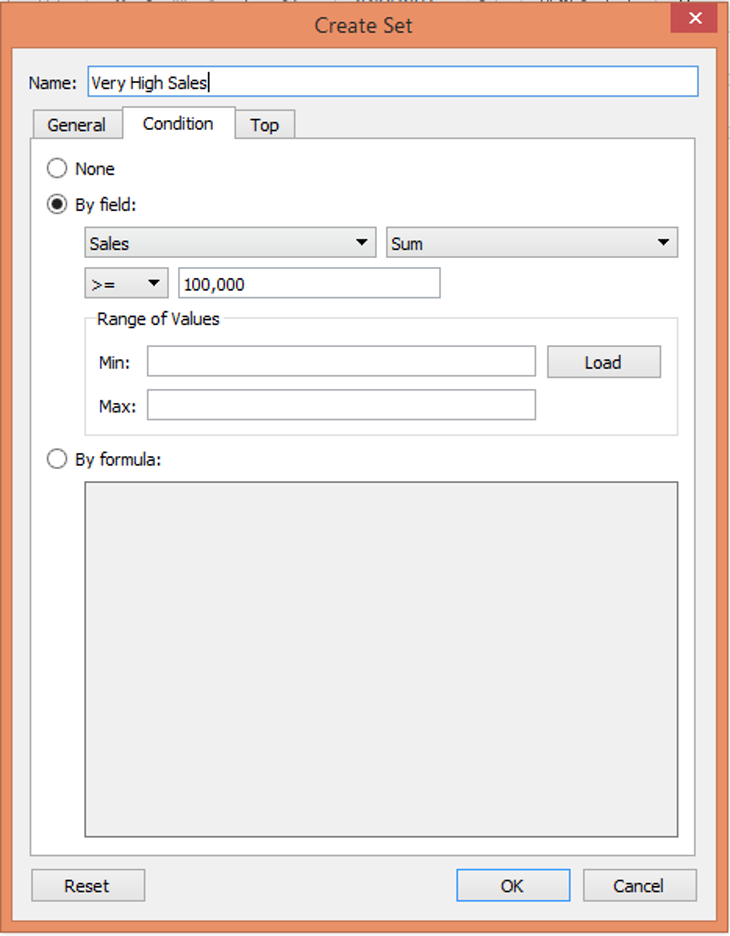
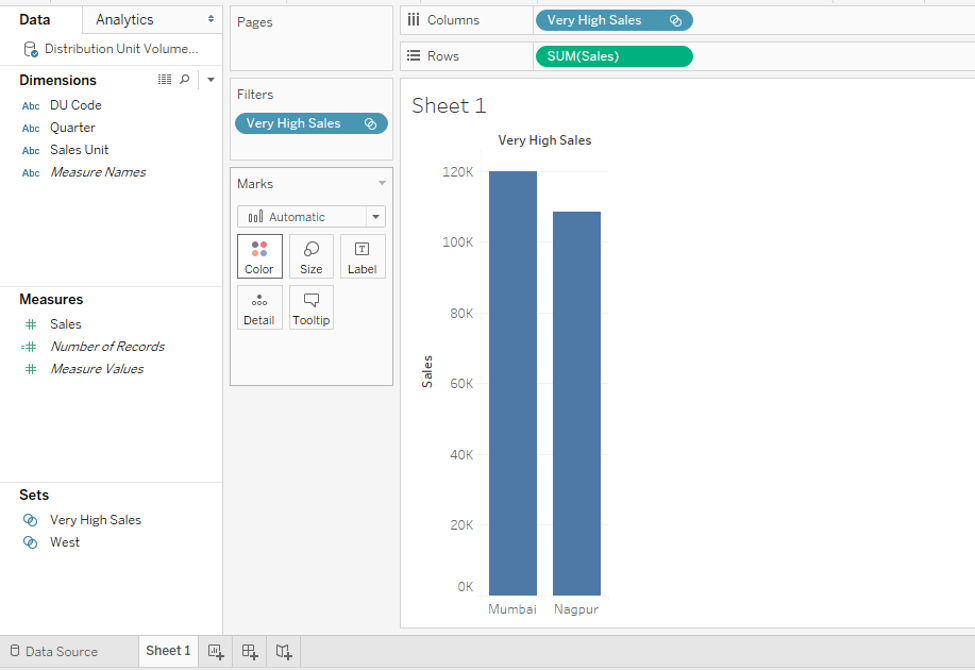
Step 13: In the above part, we created a simple set. However, in real life, we may require to create sets based on certain conditions. For that in the “Create Set” dialogue box, in the “Condition” tab, select the “By field” section. In this section, we will try to obtain those sales units where the sale is greater than 100,000. This is illustrated as follows.
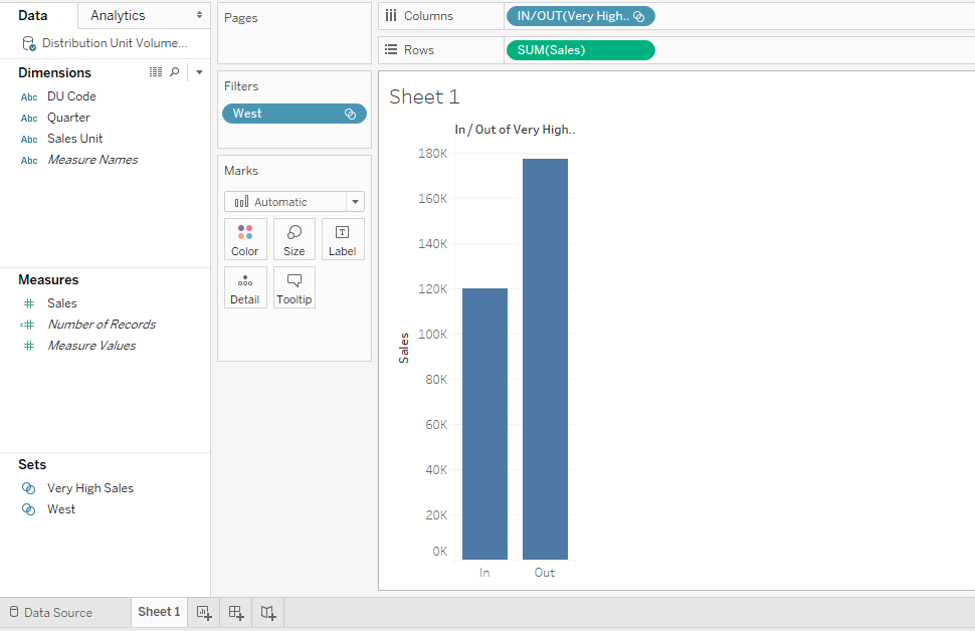
Step 14: We named this set “Very High Sales” as can be seen in the Sets section. We brought it into the analysis which is as shown by the following screenshot which shows the set in the form of IN/OUT. Then using the approach described in the preceding part, we brought the dimension values in the set into the visualization. So, in the screenshot subsequent to the below one, we can find that there are only two regions viz. Mumbai and Nagpur where the Sale is greater than 100,000. This is how we can use sets for quick insight generations.
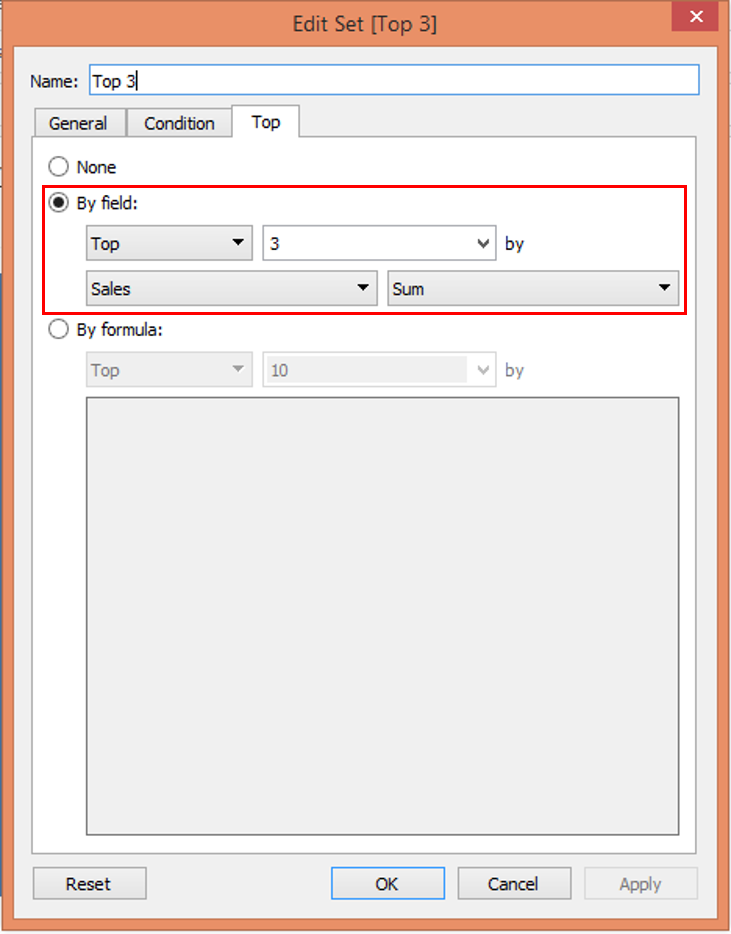
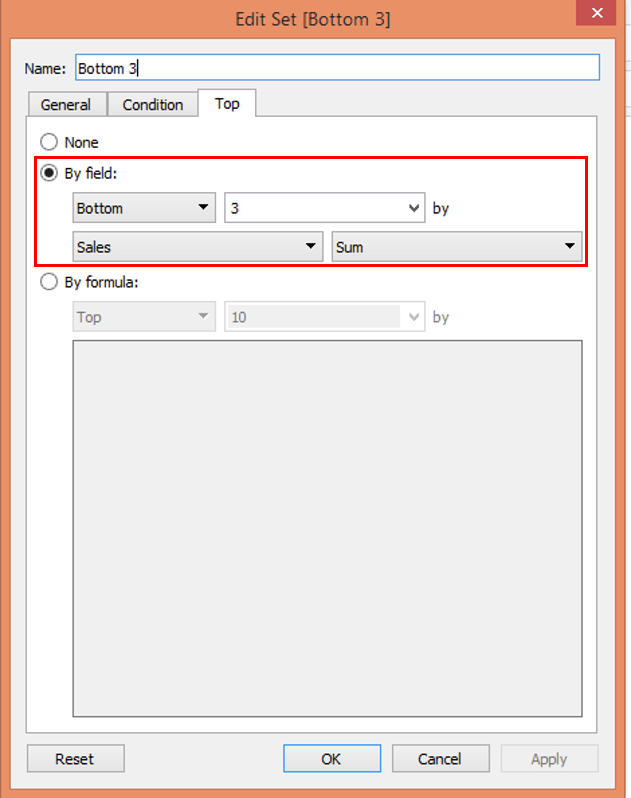
Step 15: The third option is Top using which we can create sets containing dimension values that have the highest or lowest values of a certain measure. Like in this case, we will create two sets that will contain the top 3 and bottom 3 sales units in terms of sales.
Step 16: In the “By field” section, make the selections as highlighted in the following screenshot.
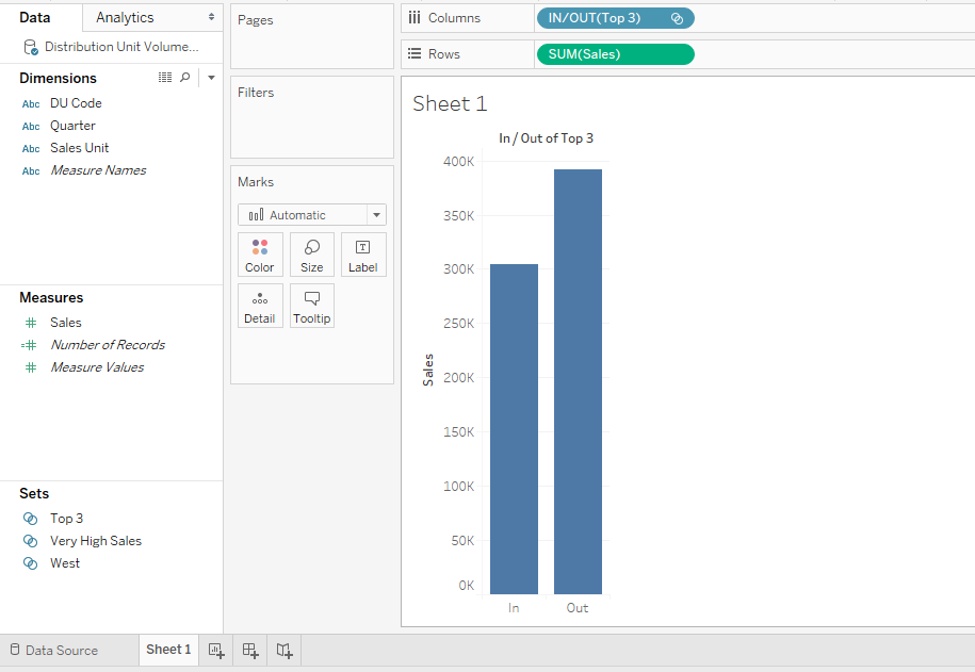
Step 17: The newly created “Top 3” set can be seen in the Sets section. Just bring it into the Columns region and it appears in IN/OUT form. Using the approach described in the preceding part, show its members in the visualizations. The In/Out, in this case, allows us to understand the top 3 vs other sales unit’s performance.
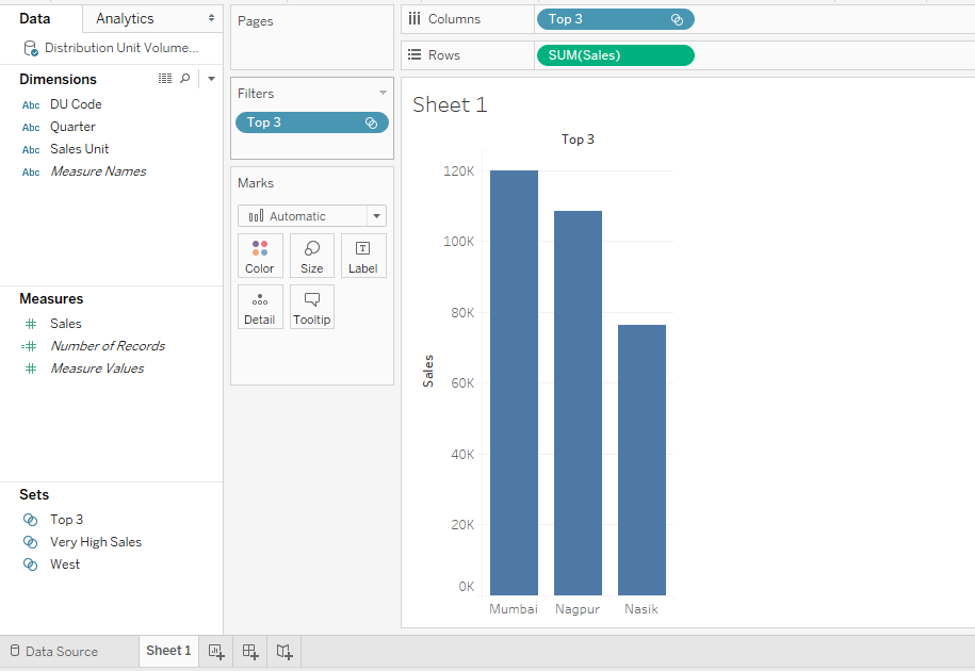
Step 18: The following screenshot shows the top three performing sales units in terms of sales. These are Mumbai, Nagpur, and Nasik.
Step 19: Now, in order to create a set of bottom 3 performing sales units, make the selections as highlighted in the below screenshot.
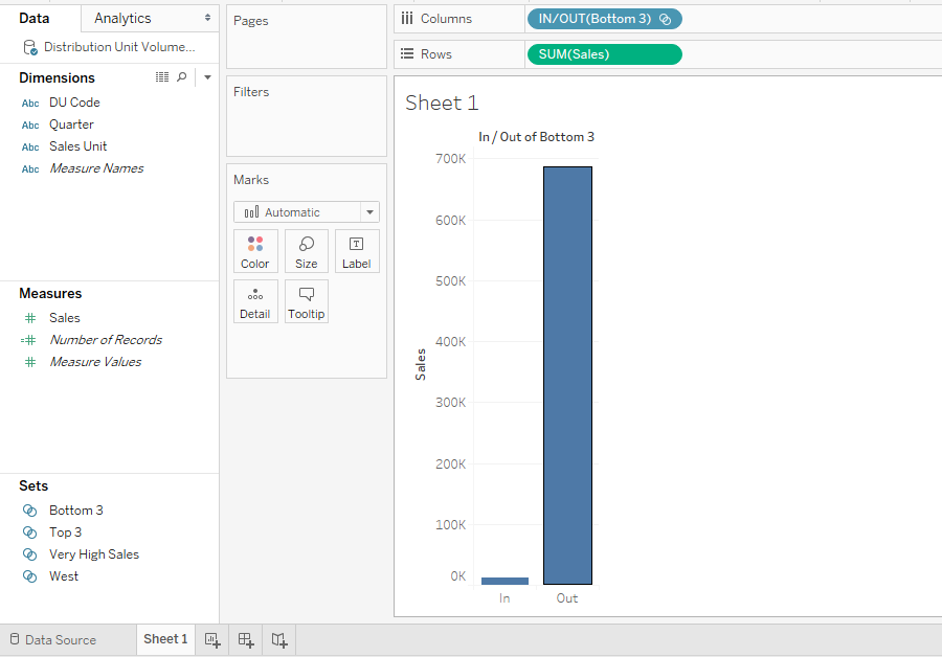
Step 20: We can see in the below screenshot, when brought into the analysis, as IN/OUT, Bottom 3 set very well tells that the sales contribution of bottom three sales unit is very negligible.
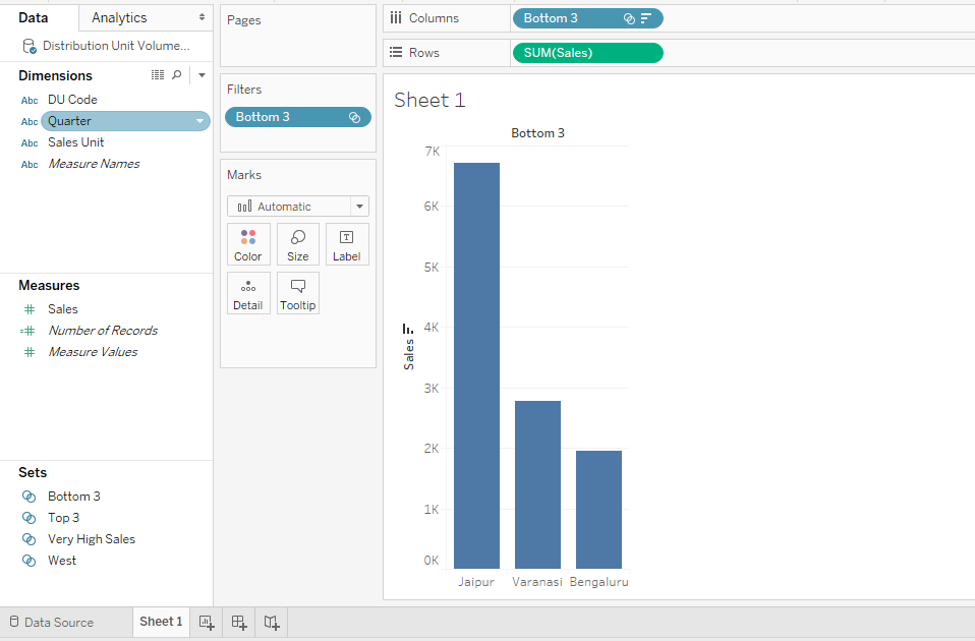
Step 21: We brought the bottom three sales units into the analysis, which are Jaipur, Varanasi, and Bengaluru. This is as shown below.
Conclusion
A set is a very powerful concept and a useful functionality provided by Tableau. It enables beautiful view-level analysis without actually affecting the original data. Moreover, the functionality of the sets allows the user to compare set vs non-set variables along with analysis of dimension values amongst the set itself.
Recommended Articles
This is a guide to Sets in Tableau. Here we discuss how to create and use sets in Tableau, using the Regional Sales dataset in the step by step manner. You can also go through our other related articles to learn more –
