Updated May 22, 2023

Introduction to Tableau Bar Chart
The bar chart signifies the data in terms of the rectangular bar with a value variable proportional to the length of the bar. When the user drags the dimension to the row and column area, the tableau marks the measure and automatically generates the rectangular bar chart. The user can work on the bar chart option in the show me pane. If the data is insufficient to generate a bar chart, this option will appear as a grey-out.
Overview of Tableau Bar Chart
In simple, tableau automatically creates a rectangular bar graph, once the user selects and measures his rows and columns shelf. This bar graph is directly proportional to the value variable and the length of the bar. If the data is inappropriate, the option is greyed out. Different types of bar charts are created in tableau with the help of measure and dimension. The creation of a simple bar chart and stacked bar chart is given below.
How to Create a Tableau Bar Chart?
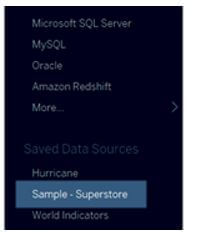
The simple bar chart can be created instantly from the sample – superstore by giving the dimension and measuring the row and column shelf.
Connect the dimension to the sample superstore of the data source.
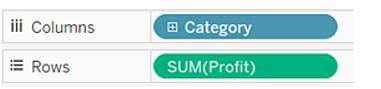
Drag and drop the dimensions of value to columns and other values as rows. Ensure that the data in rows and the other in columns provide related and meaningful insights. Tableau gives the line as a mark when the date is added as a dimension.
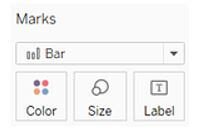
On the marks option, choose the bar from the drop-down area. If the data is given in time and date format, it changes from the actual time and differs when it gets updated.
Choose the x-axis and y-axis values to the color area in the marks card. So, it helps to check the consistency between both values. It produces multiple axes and gives a clear view of the provided data.
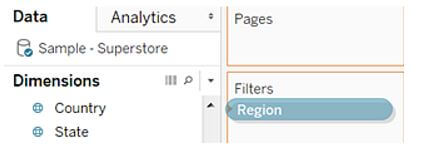
The user can filter the data by using the filter shelf. The provided data can be filtered by the filter option to get the preferred data. So it helps the user to get a clear view of unit data and how it got varies according to the seasons.
To get the final output, select ok.
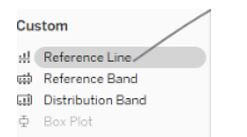
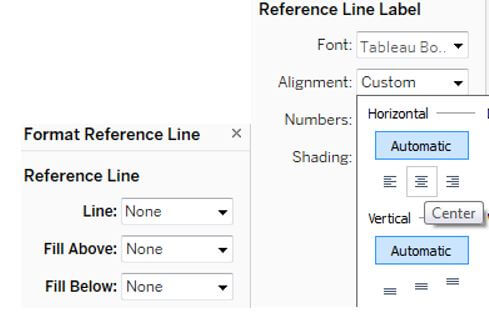
In the stacked bars, to add the total, select the show mark label option in the toolbar, and it is added to the top of every bar in the chart. When the bar is segmented according to size and color, every individual bar gets a label instead the bar total. The user can add the total once the bar is segregated like the view. It can also be configured by choosing a reference line and then provided with labels per user preference.
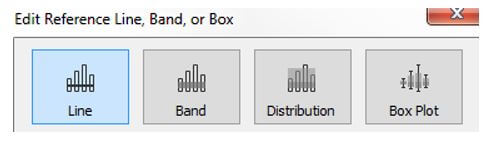
The reference line is chosen from the analytics column and dropped into the cell. Then edit the line and dialog box and set the aggregation value, then value label. Select ok once all edit is done.
The user can change the alignment under the reference line label area.
The user can make the bars colorful based on the ranges. The longer valued bar gets dark shades, whereas the minimum bars get the lighter ones. To imply this, drag the profit mark to the color option within the marked pane. It gives different colors for the negatively valued bars.
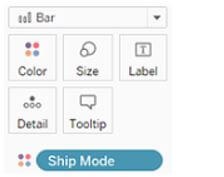
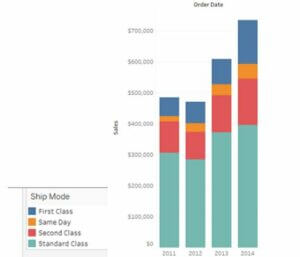
The user can add another dimension to the existing bar chart and generate a stacked bar chart that appears in varied colors. Here also give the dimension values and drop in colors.
Tableau Bar Chart Formatting
The bar is already segregated by category, so including contrast color again to the chart makes it confusing, so unnecessary coloring of the bar should be avoided. It is good if the colors are applied to give a link and different visuals on the GUI.
The opacity of the chart should be from 80% to 90% to give a pleasant look to the chart. So the saturation reduction makes the eyes not to get exposed too much to brightness, and the value given is also clear to view.
The bar chart in the tableau offers a simple way to showcase the data visualization, and the representation of unique colors makes the product a remarkable brand to the end-user. Adding primary and secondary colors to the bar chart is fine to differentiate the values.
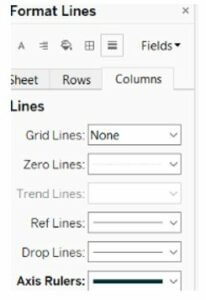
The best method to project a bar graph is to make it fixed on a solid foundation with a subtle background, and then the bar should be designed with primary and secondary colors with big fonts. So it enhances the view, and baselines and rulers should be provided to look at the accurate values. All these options can be modified by using the format option in the mark pane. The format line tab is used to modify the axis rulers for columns and rows. The ruler line and border of the bars should be thin gray and should not disturb the bar graph’s meaningful insights.
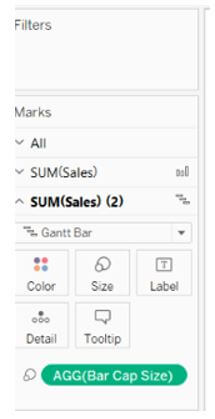
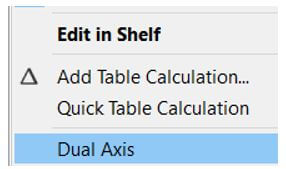
The caps can be added to the bar chart in the tableau by adding a dual axis to the existing bar charts. It is done by double click on measures on the row shelf and double click on the dual axis. Once the dual-axis is created, modify the mark type of the first measure, and the second measure should be made in the Gantt bar. Ensure that the axis is synchronized correctly to the value and, if not, choose to synchronize the axis, and all the axes are pointed to correct values.
Conclusion
The bar chart in the tableau has two main advantages, one is the user can push more information to it, and it helps to give a meaningful representation. The other is it adds value instantly, which gives the other possible comparison points.
Recommended Articles
This is a guide to Tableau Bar Chart. Here we discuss the introduction and how to create a tableau bar chart? and formatting, respectively. You may also have a look at the following articles to learn more –
