Updated March 22, 2023
Introduction to Tableau Versions
Whenever certain updates or changes are made in the software, a new version of the tool containing necessary required updates is released. Often the need to release a new version is governed by the demand of its users or the need of having certain specific features in the tool. Tableau is a widely used visual analytics tool. It comes in various forms like Tableau Desktop, Tableau Server, and Tableau Mobile, etc. Various versions of the tool are there, and the company keeps releasing updates on its official website. Facilitated by excellent support service, leveraging the updated version becomes easy for the user. In this topic, we are going to learn about Tableau Versions.
Versions of Tableau in brief
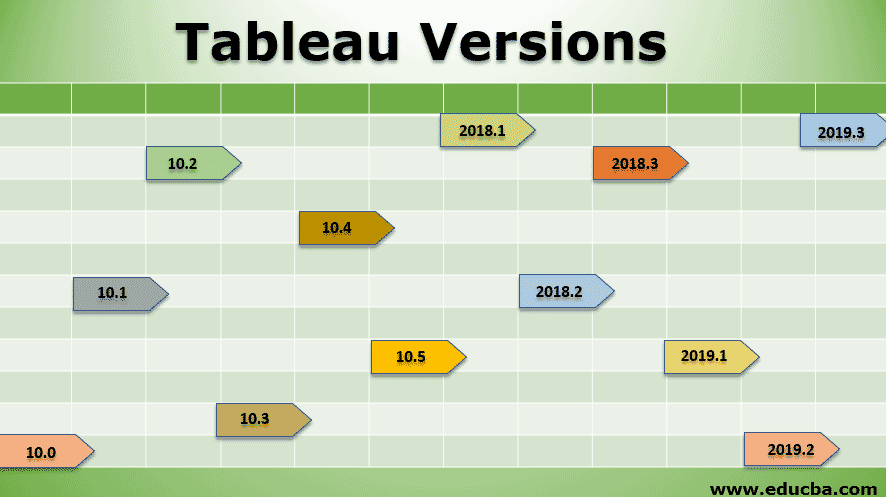
We shall now see some of the important features that were newly incorporated or improved upon and brought in the respective versions of Tableau starting from the latest version to 10.0.
1. Tableau 2019.3
- One of its special features is the Tableau Catalog. The catalog allows you to have a complete view of how the data is connected with the analytics. This is important as analytics created offers insights into what section of the data is important to a particular user.
- This version has a Tableau Server Management Add-on. This feature essentially allows execution at a greater scale facilitating increased manageability. It incorporates performance monitoring and content management features also.
- It offers analytics based on statistically significance, leveraging powerful concepts like AI in order to get deeper insights and arrive at the right results.
2. Tableau 2019.2
- Amongst the new features, the most notable pertains to parameters. These parameters can be made dynamic that governs calculations and filters thus driving the visualization accordingly.
- A vector map is another exciting feature. The feature offers sharp and smoother map-based visualizations.
3. Tableau 2019.1
- This version offered a natural language-based functionality which is “Ask Data”. Using Ask Data, insights can be produced from data by asking questions.
- The mixed content type is the feature that allows viewing data sources and workbooks on the same page.
- Exporting the insights to PowerPoint is facilitated to build highly interactive and insightful presentations
4. Tableau 2018.3
- A very powerful tool incorporated in this version was heatmap. Heatmap is a special type of visualizing data that combines the features of scatterplot along with color combinations based on variable values.
- Dynamic actions now became possible. So, visualizations could be changed in real-time just by selecting or clicking over a portion of the map. Further, navigation between the sheets became much easier.
- Connectivity with R now became more secure. This was facilitated by SSL/TLS secured connection for integration or RServe with Tableau.
5. Tableau 2018.2
- Joining datasets based on location element, when it happens to be the only common amongst them, now became possible. This proved useful in the context of spatial data.
- Nested sorting as an advanced option in sorting is a powerful analysis feature offered here
- Mobile-friendly dashboards could now be built easily. This turned out to be useful for business users, who could now build the dashboards using automatic table layouts in just a few seconds.
- A very important feature is ISO-8601 standard weeks. The feature could be now used with calendar-based calculations and visualizations and thus made the analysis more standard.
- When working with a log axis in advanced calculations, negative values could now be shown on a log scaled axis.
6. Tableau 2018.1
- Step and Jump Lines a very important concept in the analysis was introduced. The tool offers high-value insights and visualizing depicts a trend.
- A very powerful concept brought was establishing the connection from SQL server to spatial data. This opened a new avenue for deeper analysis, as custom SQL could now be leverage to derive deeper insights from spatial data.
- Clustering was made advanced by the addition of a clustering functionality. The functionality overcame earlier static character of saved clusters which now changed as the data refreshed.
7. Tableau 10.5
- A feature by the name of Hyper is Tableau’s attraction in this version. An in-memory data engine technology, it made operations pertaining to complex data sets faster.
- Power trendlines a very crucial data analysis tool when working with any type of data is an important feature of this version.
- It facilitated developers and users to create nested projects. Using the functionality, projects could be nested based on permission levels set as per the requirement. This enabled us to have a systematic structure for having projects.
- Tableau server could now be used over the Linux operating system. Features of both Tableau, as well as Linux, could now be leveraged for analysis.
8. Tableau 10.4
- Now, analysts in a team using Tableau could collaborate and discuss upon analysis, certain specific points using the tool. This was facilitated by real-time conversations functionality offered by the tool.
- Tableau started supporting Okta Mobile Connect, increasing the scope of Tableau-based mobile analytics making it more versatile.
- Data virtualization now became possible facilitated by the Denodo connector. This facility opened new doors for analysis with virtualized data.
9. Tableau 10.3
- Data could be loaded faster on workbooks from Tableau server. This was due to the automatic pre-caching of queries.
- Tableau Bridge facilitated connecting live on-premises data from Tableau Online thus making users employ cloud functionality.
10. Tableau 10.2
- It brought useful improvements to the Marks card. Now, all the pills could be viewed at a glance without requiring scrolling.
- In the context of graphs, now separate legends could now be created for individual measures.
11. Tableau 10.1
- Geocoding is a very important feature introduced. It essentially means that IATA and ICAO codes are now recognized by Tableau and airports could now be mapped easily.
- Analysis of continuous fields was taken to another level by facilitating drill-up. This could help create dynamic and out-of-the-box visualizations.
12. Tableau 10.0
- Leveraging site SAML (Security Assertion Markup Language) on Tableau server based on a user now became possible.
- New administrative views gave insight into the licensing and usage of Tableau Desktop.
In each of the versions of Tableau certain features were added or updates made into. Now, let’s see what are the advantages and disadvantages associated with Tableau in general.
Advantages and Disadvantages of Tableau
Below are some of the advantages and disadvantages:
Advantages
- The visualization features and capabilities offered by Tableau are excellent. They are one of the best in the industry.
- Tableau offers users to create visualizations driven by statistical analysis, AI. E.g. in Tableau an insightful time series analysis can be performed. Moreover, the tool supports connectivity with powerful statistical programming packages like R.
- Tableau supports connectivity with multiple data sources
- It is supported on mobile platforms also offering an easy-to-leverage approach.
Disadvantages
- The license cost of acquisition is quite high and so it is essentially preferred by large enterprises.
- Though easy to use, some of the functionalities require technical expertise like knowledge of SQL
Conclusion
Any organization, in order to emerge as the number one player, keeps updating its tool and releases its versions at intervals of time. There are always pros and cons associated with the tools and their versions, but then the decision to use a tool is solely governed by the organization’s preference.
Recommended Articles
This is a guide to Tableau Versions. Here we discuss the respective versions of Tableau with the advantages and disadvantages. You may also look at the following article to learn more –
