Updated March 23, 2023

Introduction to Tableau Workbook
Software is made of multiple components. In technical terms, these components are addressed as objects. Any analytics tool or programming language has multiple objects. Basically, it is these objects which complete the concept of the tool. Understanding software is not possible without understanding the objects and their importance. The objects can have a certain hierarchy which means there’s an object which has multiple objects. Tableau is a visual analytics tool that, too, is made of objects. A very important object in Tableau is Workbook. As the name suggests, it’s literally a book that contains the work and hence the name.
Understanding a Workbook in Tableau
The work done by a user in Tableau gets performed in the workbook file. The workbook can be seen appearing in its own window. Important analysis done in a particular context is contained in the workbook. We can have multiple workbooks as per the requirement. The extension of a Tableau workbook is .twb.
The Tableau workbook consists of various objects such as Sheet, Menus, Sheet tab, etc. Each of these objects is important and has its own relevance. A sheet in Tableau can be a worksheet, a dashboard, or a story. All these have a certain context-specific significance.
Creating a Workbook in Tableau
Creating a workbook in Tableau is pretty simple. It is just like what we do in MS Excel or any other similar tool.
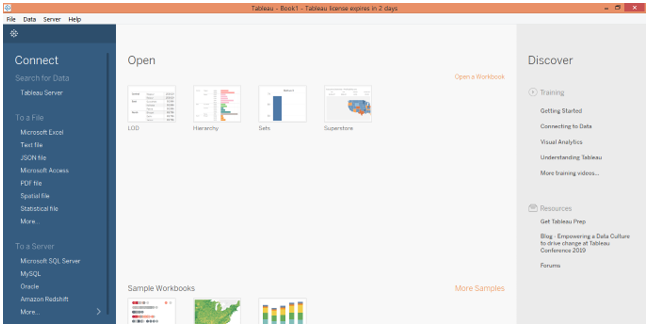
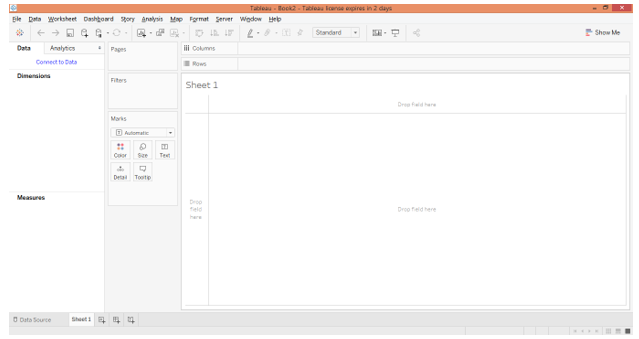
1. When we open Tableau, the initial screen looks as below. If we observe carefully, multiple options are associated with a workbook, which we shall see in the subsequent part.
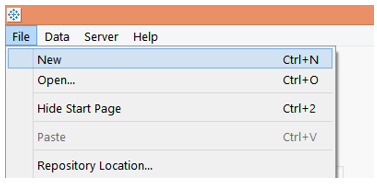
2. First, we can create a workbook by clicking on “New” in the File menu. We can open an existing workbook by clicking on Open in the File menu.
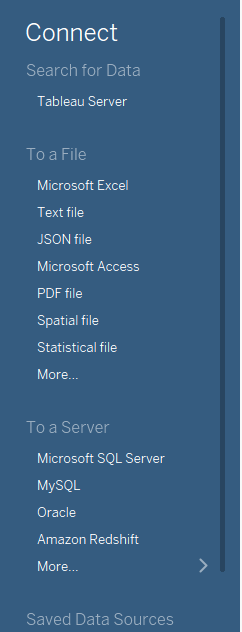
3. We find that we can connect to a particular data source which is as shown in the screenshot to the left side. When we connect Tableau to a particular data source type, the operations start taking place in a workbook.
4. We can open an existing workbook by clicking on “Open a Workbook”, and the existing workbooks are shown under the Open option.
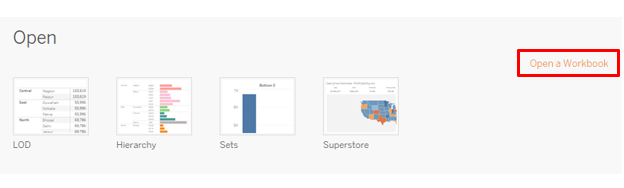
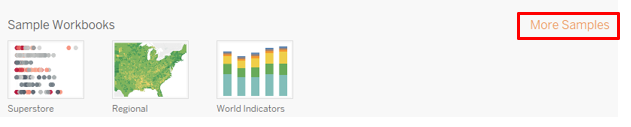
5. Tableau also provides us with some sample workbooks for guidance. We can open any of them and explore more such guidance sample by clicking on “More Samples”
6. When we click on option “New” in the File menu as illustrated in the above section, a Tableau workbook gets created.
Working with Tableau Workbook
In order to understand how a Tableau workbook works, it is essential to understand its components or objects which can be understood by understanding the Tableau workspace. In order to have a proper understanding, we load an existing workbook.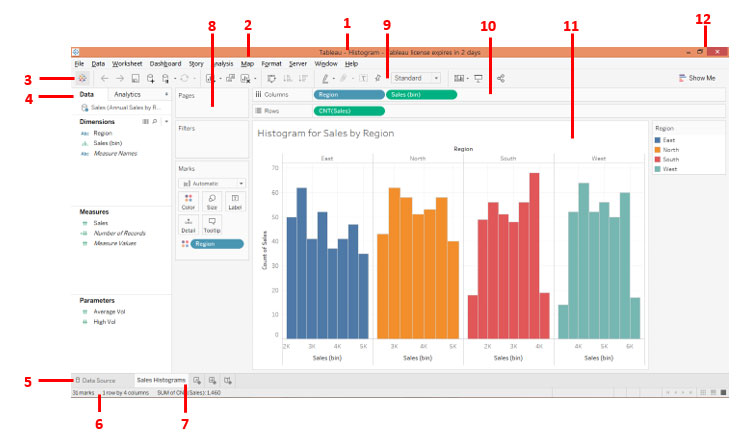
As can be seen above, we have numbered the components of the workbook.
They have been described order wise, in brief, as follows.
This is the workbook name. In this case, it is Histograms as the workbook contains Histogram analysis. The name of the workbook must suit the context.
- Menu Bar: This bar in Tableau contains multiple menus similar to the one that we find in MS Excel, MS Word, and MS PowerPoint.
- When you click on this icon, it takes us to the “Connect” section. In order to go back to the workbook, click on it once again.
- SideBar: This section contains two important parts viz. Data pane and Analytics pane. Whatever data set we load into Tableau can be seen in the Data pane along with the requisite Dimensions, Measures, and Parameters. The Analytics pane contains functionalities pertaining to summary statistics and modeling.
- Data Source Tab: When we load data into Tableau, the data gets reflected in this tab. Click on it to view the data which must be examined prior to proceeding to the analysis.
- Status Bar: It essentially gives the status for the workbook based on certain metrics like a number of columns, rows, etc. On the right-hand side of the bar, we can find three icons. Click on them in order to view the components including the visual analysis in a particular way.
- Sheet Tab: This consists of worksheets, dashboards, or stories. We can create multiple sheets which will be visible in this tab.
- Cards: Contains Pages, Filters and Marks card. Among these, the Marks card contains important and useful options that are frequently used.
- Toolbar: This bar contains various functionalities that can be easily applied through a click on the symbol.
- Shelves: Contains Column and Region shelves. Dimensions and Measures have to be brought into them. Based on where they are brought, the visualization gets generated.
- View: This is a very important component in a workspace. It is basically here that the visualization which we have in mind gets generated. It consists of various elements like Title etc.
- Last but not least, the Minimize, Restore Down, and Close buttons.
Options Associated with Tableau Workbook
1. We can print the workbook or save it as PDF using the procedures which have been shown in the following screenshot and the one subsequent to it.
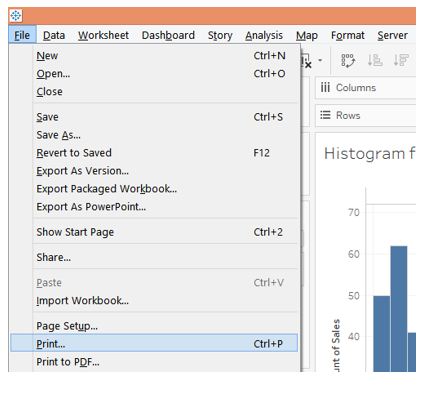
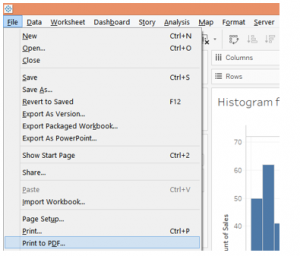
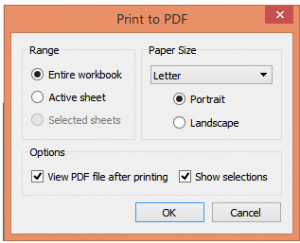
2. Clicking on “Print to PDF” pops-up the following dialogue box. Select “Entire Workbook” option from the dialogue box in order to print the entire workbook.
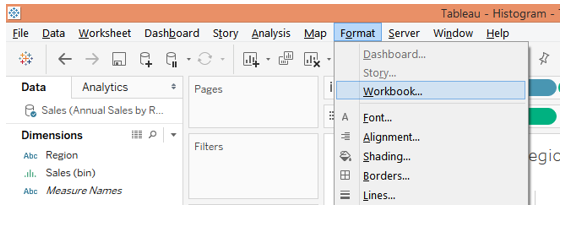
3. Now, we can format the workbook settings, by clicking on Workbook under the Format menu.
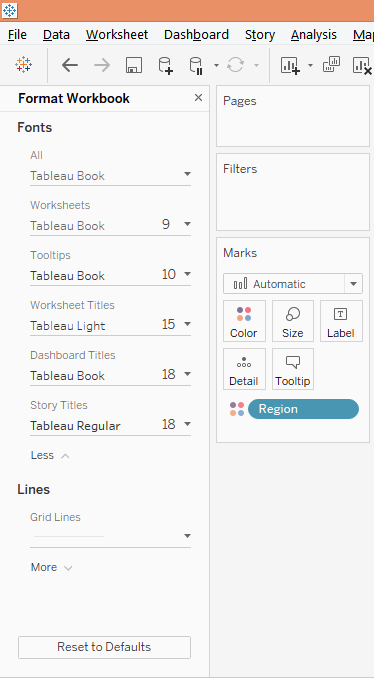
4. When we follow the above procedure, we get various options pertaining to the “Format Workbook” section.
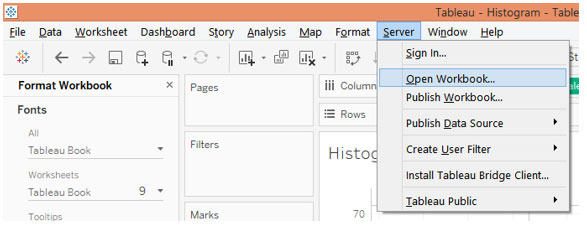
5. We can open a workbook from as well as publish a workbook on the server. This can be done by clicking on the required option from the Server menu as shown below.
Conclusion
A workbook is a crucial component of Tableau. It is similar to a workbook in MS Excel. So, in Tableau, too, we have a hierarchy of objects in which the workbook object stands higher in order. The object acts as a parent object. Without a workbook, Tableau would be blank.
Recommended Articles
This has been a guide to Tableau Workbook. Here we discuss how to create workbook in tableau along with a few illustrations. You may also have a look at the following articles to learn more –
