Updated May 22, 2023
Introduction to Tableau Bins
Bins are a precious tool in many Tableau data analysis settings. Tableau bins are equal-sized containers with data values that fit the bin capacity. We’ll also name it a statistical distribution of data since it divides a collection of information into a group of regular intervals or sizes. Bins are quite beneficial because they provide a systematic information range that allows us to organize data better and uncover trends. To transform continuous measures to discontinuous values/points, bins were utilized.

What are Tableau Bins?
Tableau’s idea of creating bins and histograms in real-time is fantastic, but it does have certain drawbacks. For starters, bins cannot be used in computations. Tableau, it appears, offers a data type for bins called numerical bins. Group members also use bins; however, they are user-defined. They always are designed based on Measures. They organize the information. Bins split a collection of information into equal-sized groups, making the data and the presentation more structured. In the Bins, just the numbers on the left will be included. By right-clicking on the bin name and choosing edit, we may apply changes to the original Tableau bin. We may modify any bin parameter from such a panel according to our demands.
How to Create Tableau Bins?
Tableau Bins are comparable to SQL Buckets in that they let users build a range of information. Creating Tableau Bins is a straightforward procedure.
To build Tableau Bins, follow the procedure below:
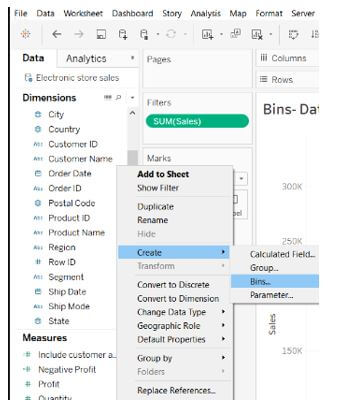
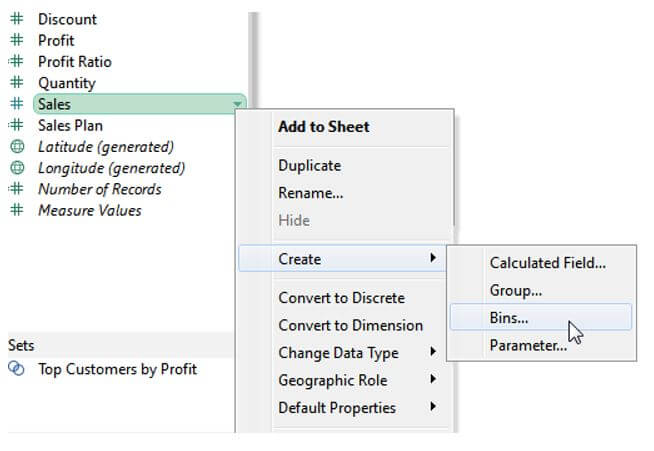
Step 1: Go to the Data pane and right-click on the field or level from which we wish to get data.
Step 2: Tap on Bins after selecting the Create option.
It will bring up the Create Bins dialogue box, where you can fill in the details and set up our bin.
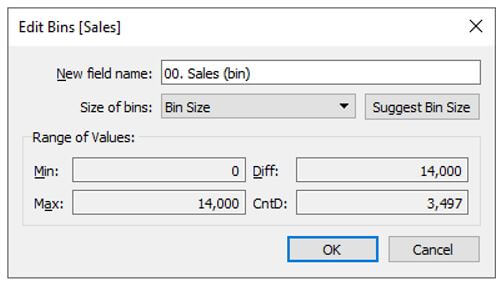
Step 3: When we select the Bins option, a dialogue box will appear on the screen. One can use the suggested field name or give a new field a different name. We can apply different settings for the container we want to build from the Create Bins dialogue box. Users are initially prompted to give the new (bin) field a name. The very next step is to determine the bin’s capacity. Also, for the chosen data set, choose the “Suggest Bin Size” option to have a bin size recommendation from Tableau.
Step 4: In the Quantity of Bins field, type a value. One may also use the Suggest Bin Size option to have Tableau offer a Bin Size for the data collection selected.
Tableau uses the following equation to determine the best Bin size:
The following are the bin size parameters:
- Min: It indicates the field’s minimal value.
- Max: It suggests the field’s maximum value.
Diff represents the difference between both the Min and Max variables.
CntD represents the overall number of different values in the data.
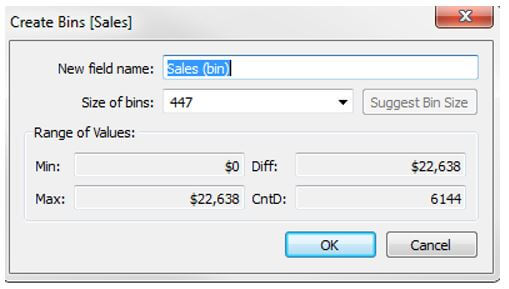
Once supplied with all the essential parameters for a bin, hit OK.
Step 5: The Sales (bin) bin we just generated is now visible in the Data pane. Users could use it in visualization by clicking and dragging this bin field onto the Columns or Rows area. Every bin in the view would operate as an equal-sized unit that summarises information for a specified value range after we’ve inserted a binned dimension. Each bin name will identify the lower bound of the series of values allocated to the bin, and columns or row headers will be formed. It’s significant to mention that the lower threshold is inclusive.
How to Delete Tableau Bins?
In Tableau, deleting the Bins is simple and uncomplicated. To do that, right-click on the one that wishes to remove to start bringing up the context menu. Then choose the Delete option from there.
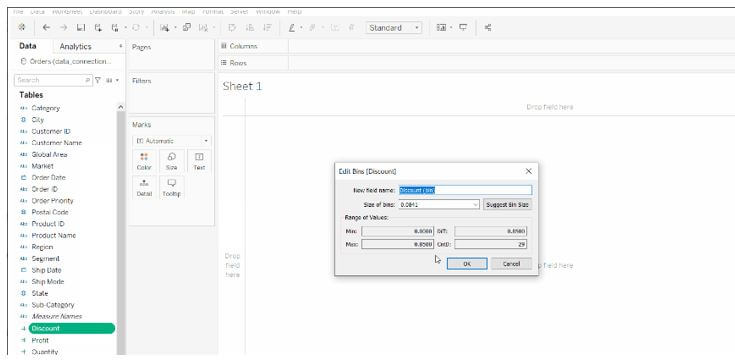
Tableau Bins Dataset
The dataset that I have used here is SalesDa.csv. A hypothetical office supply company’s sales data is included in the dataset. As just a Text File, we could import it into Tableau. Access the sheet view, next right-click on the Total Sales variable, and choose to Create > Bins… from the drop-down menu, as seen below.
Example of Tableau Bins
In this example, I have taken those measures From the table city and total sales(using a field city as bins and dividing the Sales value).
Step 1: Bin Size is a parameter that defines the bin size. I utilize a variable here to make it accessible to my end users when they want to modify the bin size to help with their assessment.
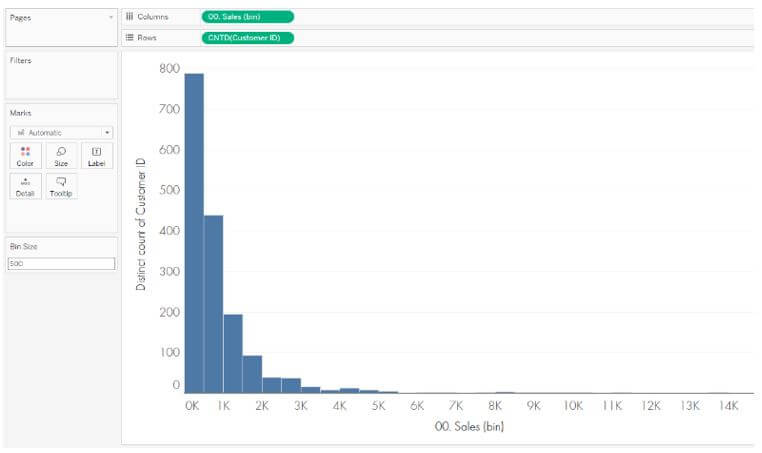
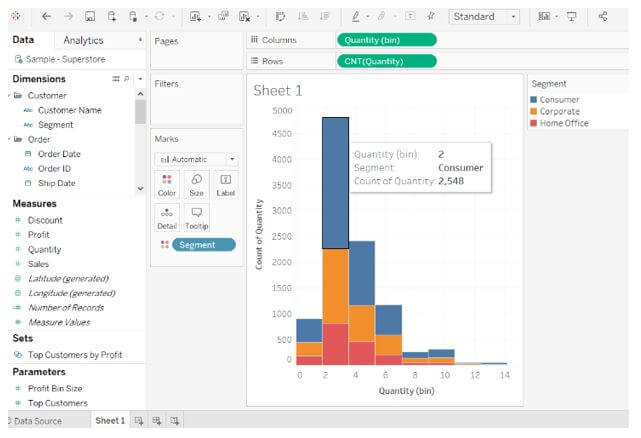
Step 2: The sales for every row of our data are binned in this histogram. As a result, we’re tallying the consumers with at least one sales row in each bin. With a constant X-axis and Y-axis, the image shifts to vertical lines. The continuous Quantity(bin) dimensions replace the measure Quantities with SUM aggregate on the column shelf. The Quantities field is moved to the rows level, and the aggregate method is changed from SUM to CNT or CNT/CNT (Count).
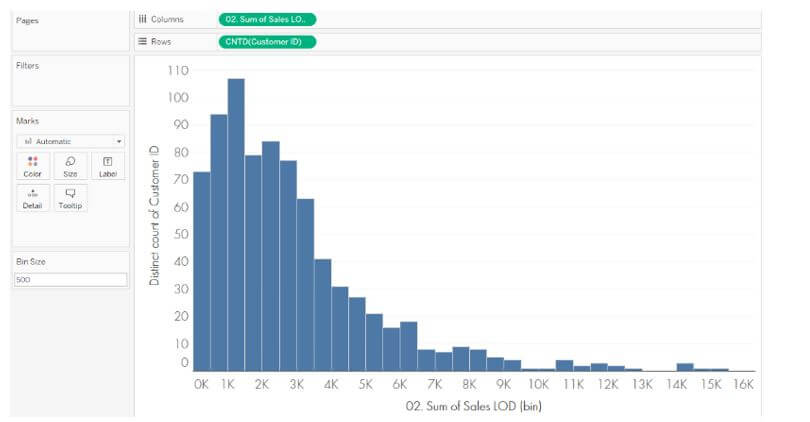
Step 3: The sum of sales is given here by creating a bin size.
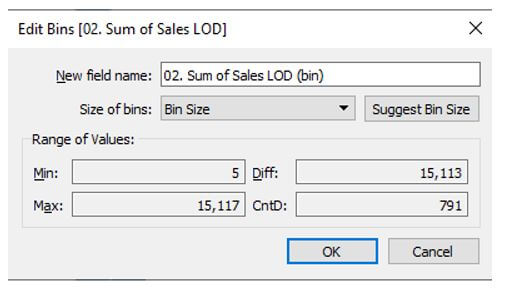
Step 4: The below screenshot shows the new bin field, which defines total customer sales.
Step 5: The association between the segment field and the number of items per order is visible in the screenshot below after adding the segment field to the color shelf.
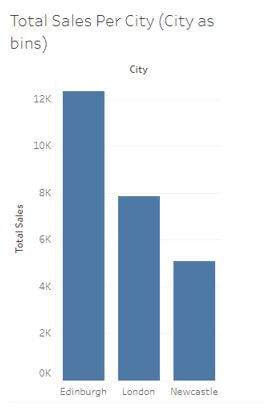
Step 6: A city’s final binned sales report is shown below.
Conclusion
Tableau bins, as previously described, are used to divide data into equal-sized groups when displayed on a chart. Bins can be containers that hold a defined range of values from the discrete or continuous variable used to make them. It also highlighted the processes involved in creating Tableau Bins. It’s critical to unify the data as they gather and handle it across multiple applications and data in the business for a complete performance evaluation.
Recommended Articles
This is a guide to Tableau Bins. Here we discuss the introduction and how to create and delete tableau bins with examples. You may also have a look at the following articles to learn more –
