Updated March 23, 2023
Introduction to Map Layers in Tableau
In this article, we will learn about Map Layers in Tableau. Tableau is a visual analytics tool provides excellent analytical capability by providing map-based insights. Map-based insights have special significance as they allow stakeholders to directly expose their minds by forming the context-based image. The geographical element associated with maps provides the user with this capability. Maps in Tableau provide extensive functionalities using which we can create the map-based analysis as required. One such very strong and important functionality is “Map Layers” which basically allows us to customize the map-based analysis based on various features provided in the functionality. Without this functionality, the map feature of Tableau cannot be considered complete.
Working with Map Layers in Tableau
To demonstrate the concept of map layers in Tableau, we will work on a simple dataset that contains sales and profit percentage figures for a product for various states in the US. We will work with the map layer using this data. Let’s go through the step-by-step process as follows:
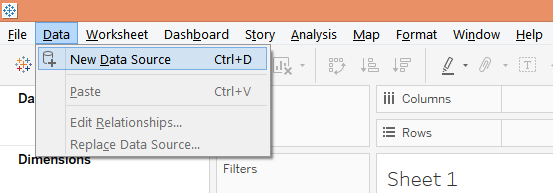
Step 1: Load the requisite data source into Tableau. For that click on the “New Data Source” option in the Data menu. Alternatively, click on “Connect to Data”.
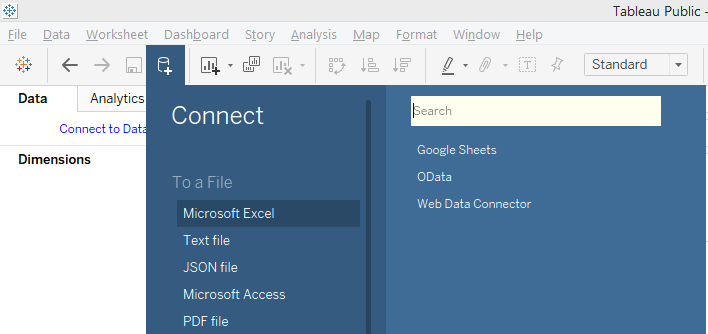
Step 2: In the Connect, select the appropriate data source type. In this case, it is MS Excel, so click on Microsoft Excel as shown below.
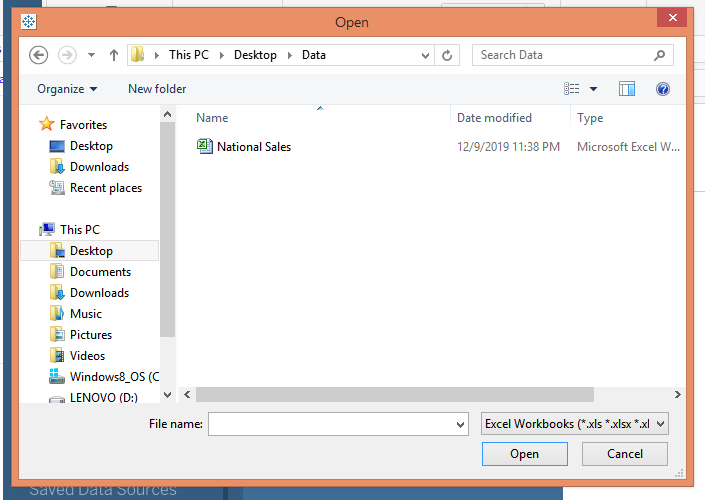
Step 3: Select the requisite Excel file from the location it is stored as shown below. Finally, click OK to load it.
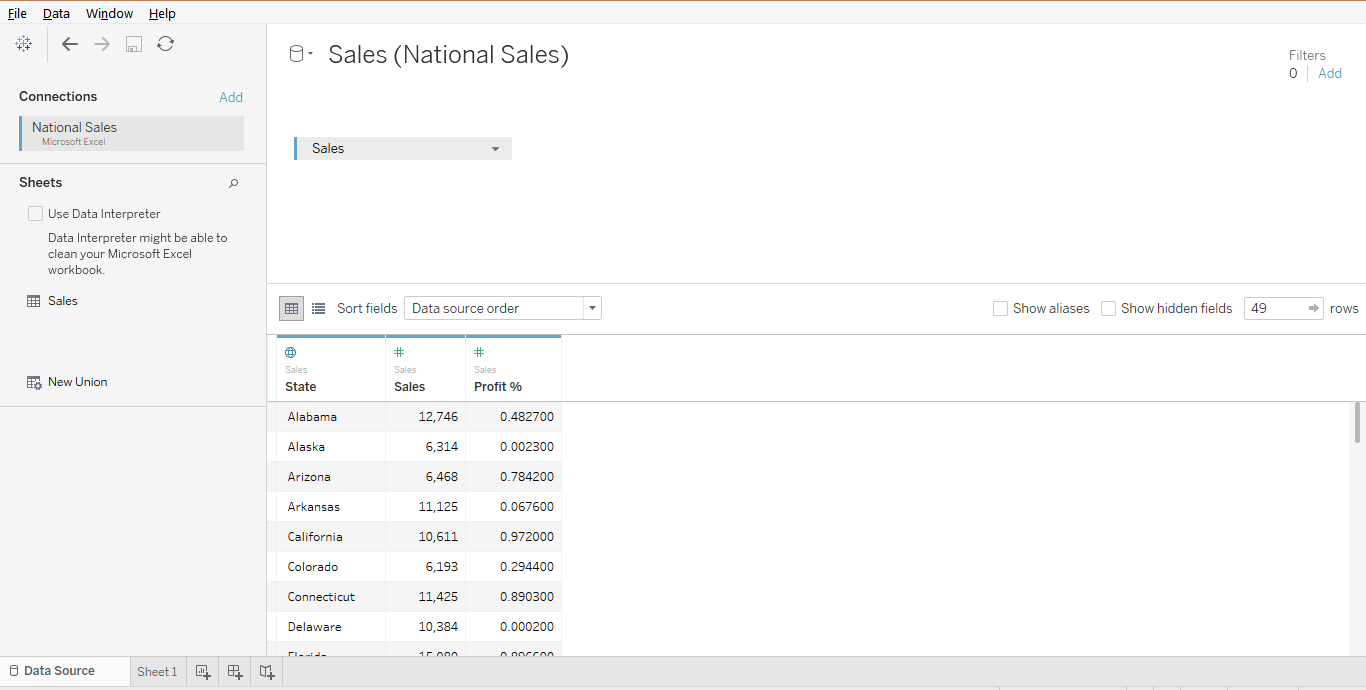
Step 4: If the data gets loaded into Tableau successfully, then it can be seen in the Data Source tab as can be seen in the following screenshot.
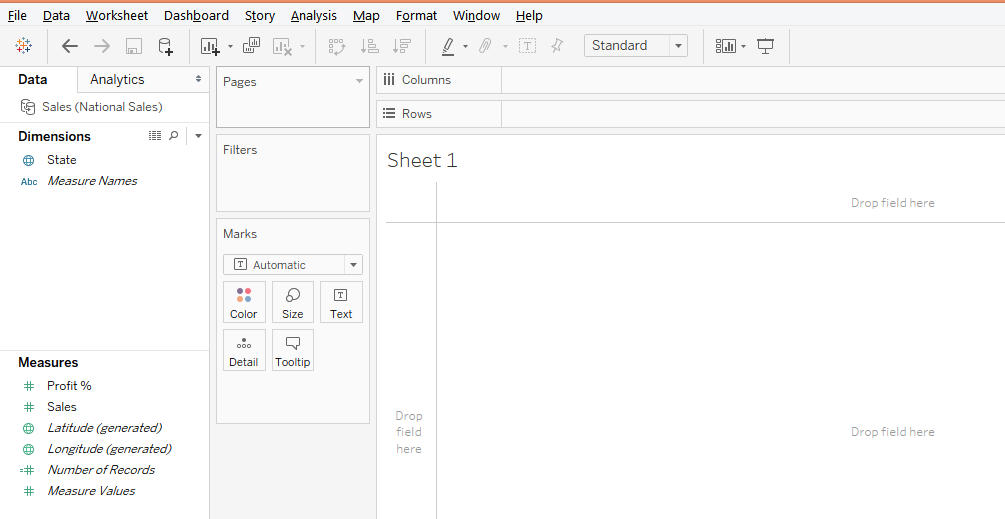
Step 5: Moving to the sheet tab, we can find the dimension and the measures present in the respective sections as can be seen in the following screenshot.
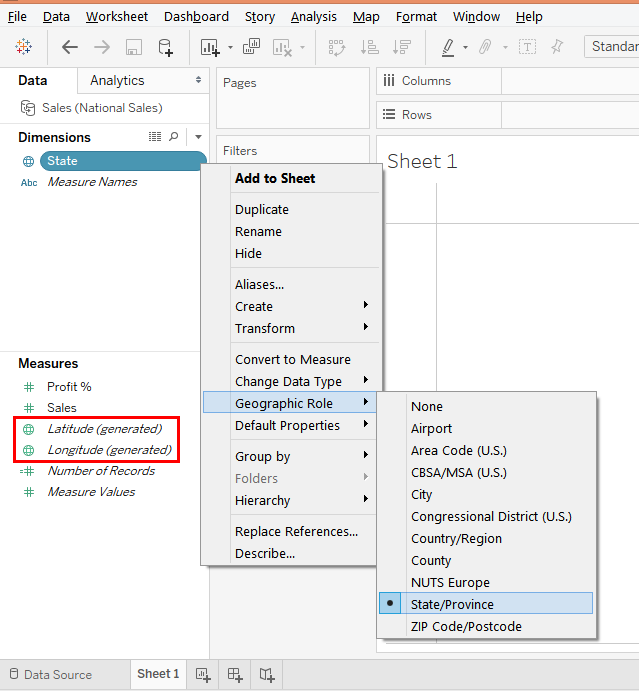
Step 6: In order to work with maps, it must be ensured that the concerned dimension(s) is assigned a geographic role. By this, we essentially mean that the dimension represents some geographic entity. The following screenshot illustrates how we assigned the “State/Province” character to the State dimension. Now, the value of dimension State will automatically map with the geographical features over the map.
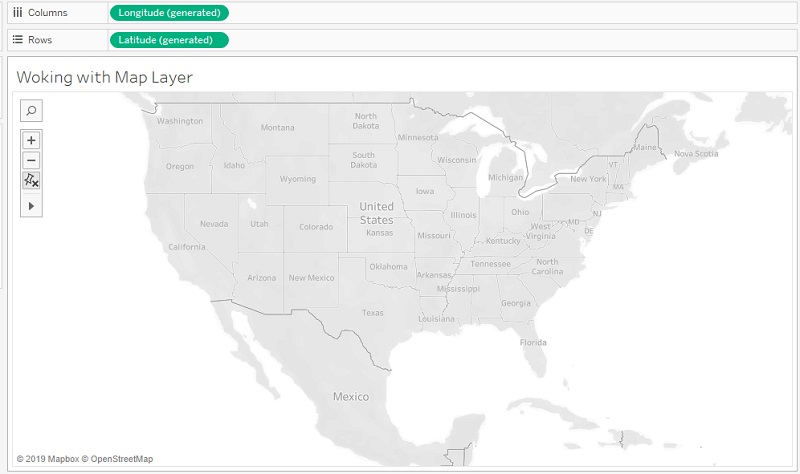
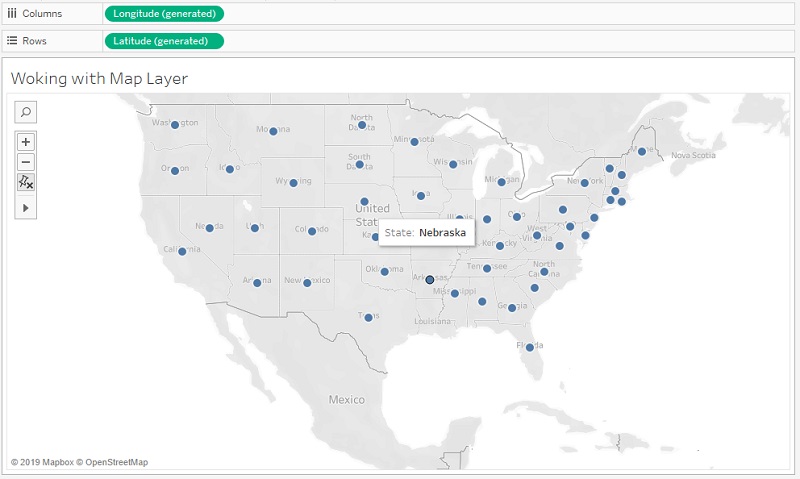
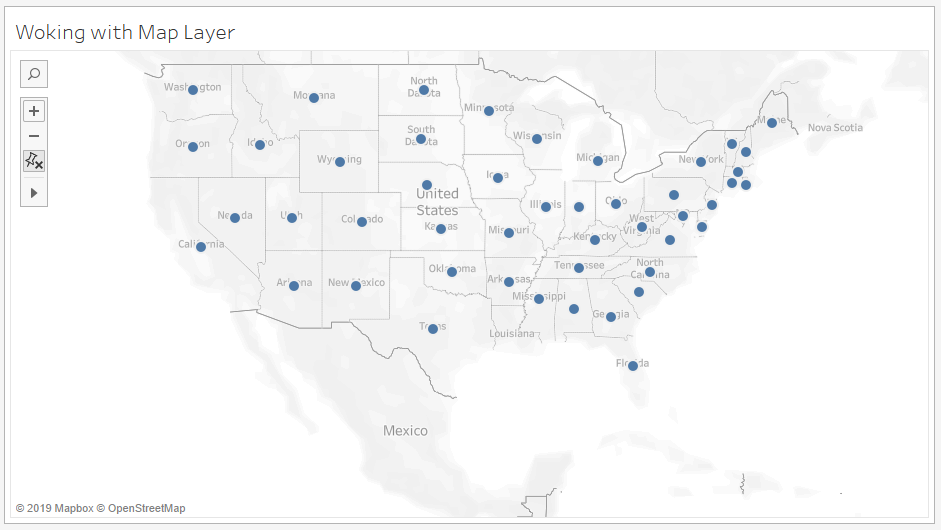
Step 7: We find Latitude and Longitude generated in Measures as highlighted above. Double click on each of them to bring them into the sheet. The following screenshot shows Longitude (generated) and Latitude (generated) being brought into the analysis. When we bring them a map gets loaded. We have zoomed the map-based to highlight the US.
Step 8: Now, drag State dimension on detail in Marks card, and we get the map-based visualization as shown below. The states could map correctly because of the steps, discussed previously, that we followed correctly.
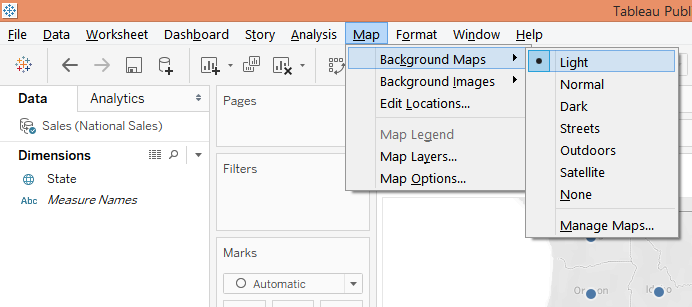
Step 9: We can change the background of the map by choosing from amongst the various options as illustrated in the below screenshot.
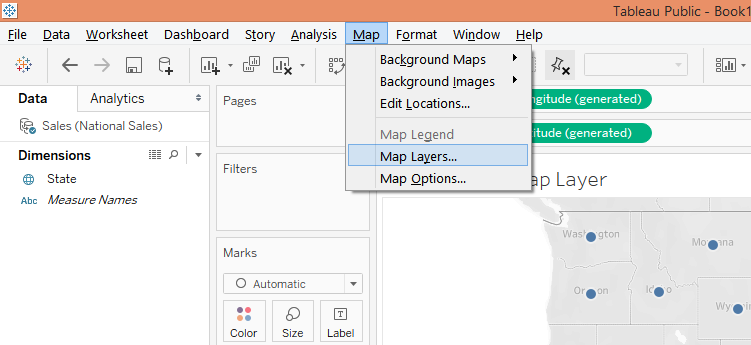
Step 10: Now, coming to the most important part pertaining to maps which is Map Layers, click on the “Map Layers” option under the Map tab as illustrated by the following screenshot.
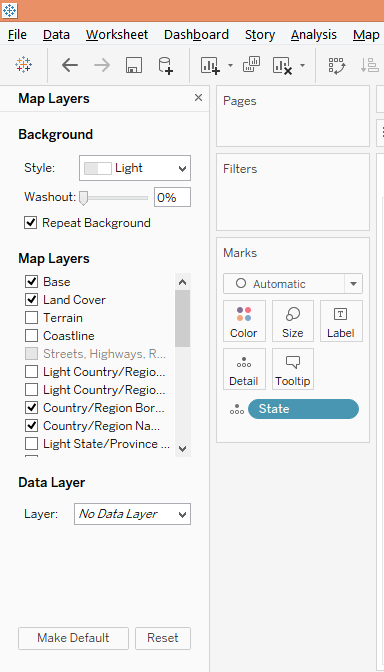
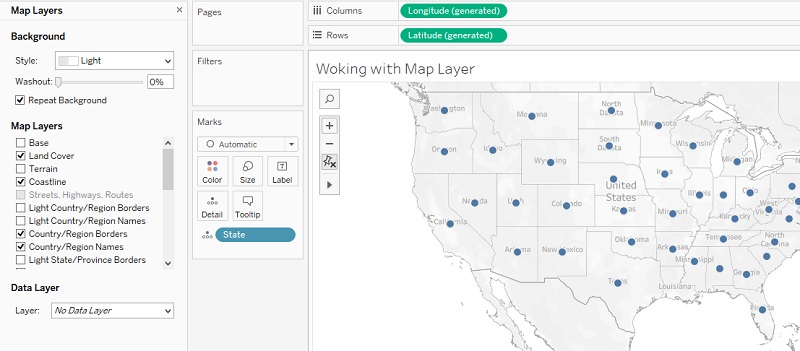
Step 11: When we click on the Map Layers option, the Map Layers pane pops-up on the left side of the window. The Map Layers section has been shown below. Go through each of its elements carefully. We can find that there are various options pertaining to Background, Map Layers, and Data Layer.
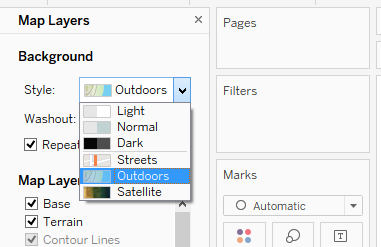
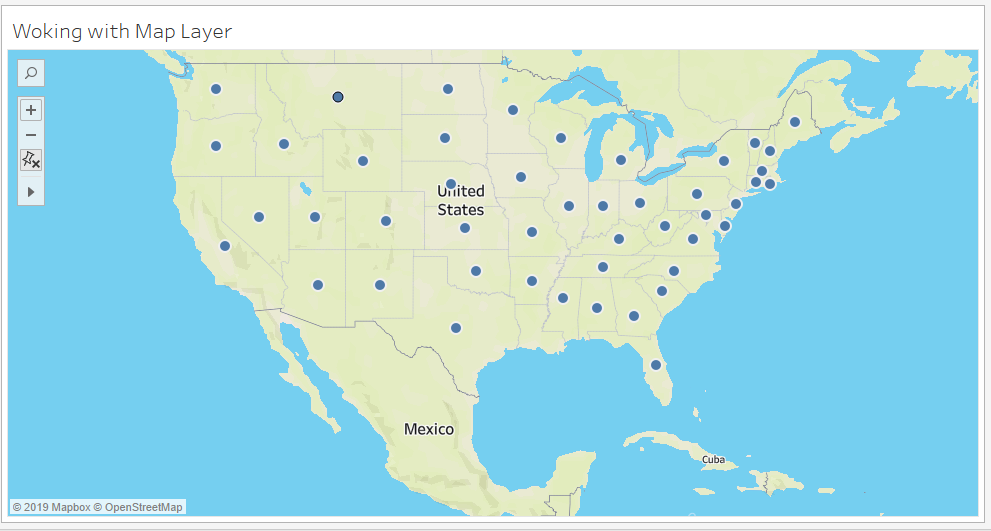
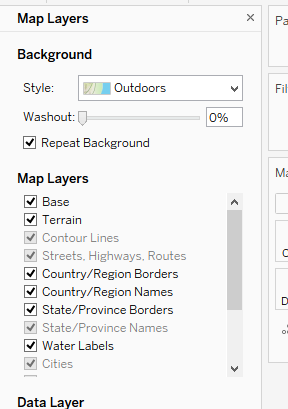
Step 12: To begin with, in Style under Background we can set any style. We selected the Outdoors option under the style and observe how it affected the visualization as shown by the screenshot subsequent to the below one.
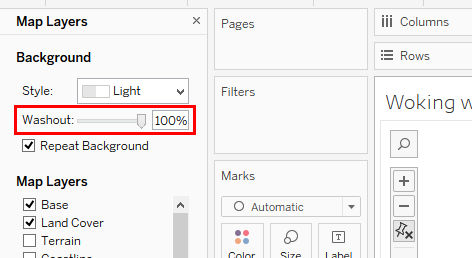
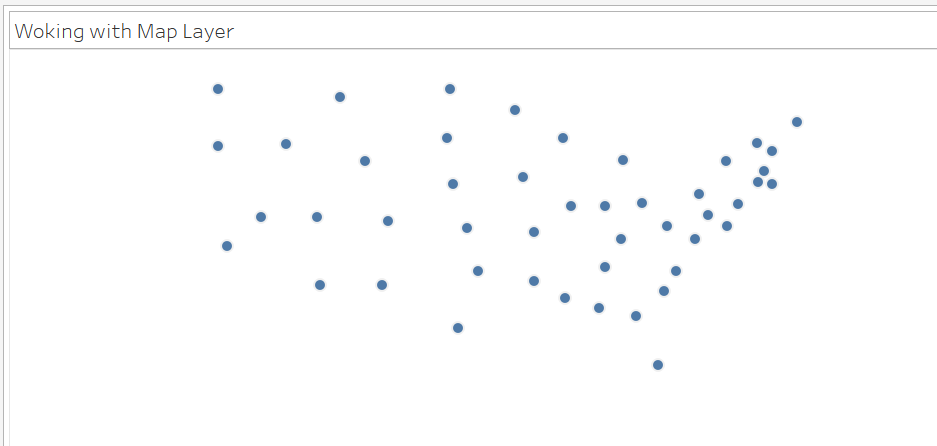
Step 13: The Washout feature highlighted in the below screenshot allows us to set the transparency. We set it to 100% and observe what it did to the map as shown by the screenshot subsequent to the below one.
Step 14: The important part of this section is Map Layers. As we can see in Map Layers, we find various options like Base, Terrain, Country/Region Borders, etc. Some of these are checked and some are greyed-out. This depends on what Style you have selected currently. In the following section, we have the “Outdoors” style selected, and corresponding map layers have been made available for this style.
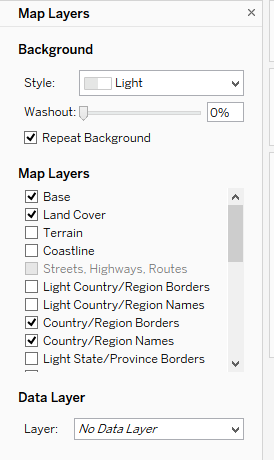
Step 15: Now, we selected Light Style, and observe the map layers are not the same as what they were above. So, the background style governs the map layers.
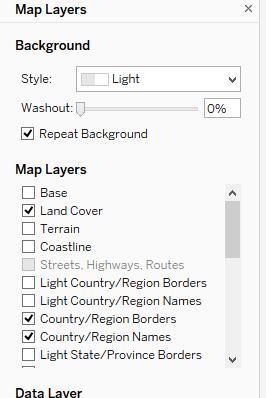
Step 16: As shown in the following screenshot, we unchecked the Base option in Map Layers. We just don’t want the base to be reflected in the map. Observe the updated map as shown by the screenshot subsequent to the below one.
Now, we checked the Coastline option in Map Layers, and observe the updated map in the following screenshot. We now have the coastline around the US highlighted.
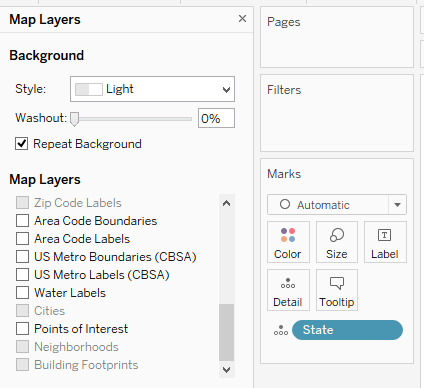
Step 17: Scroll down in Map Layers to see what all layers are provided. Remember, certain options get greyed-out based on the context. And the options should be experimented to understand their effects and usages.
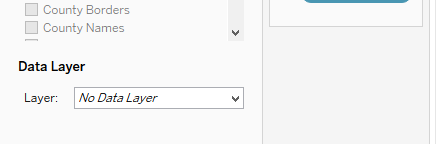
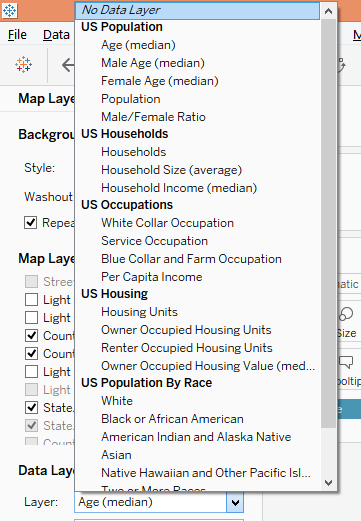
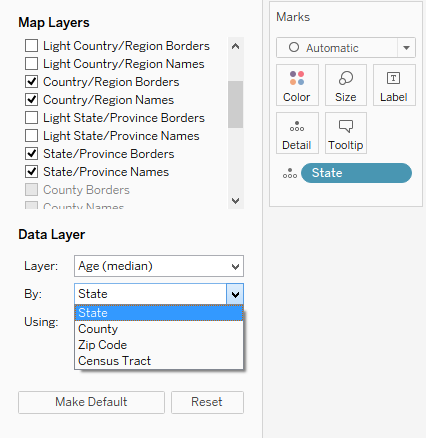
Step 18: Now, a very important option in Map Layers is Data Layer. The default selection for this option is “No Data Layer”. Click on the menu to explore various options as illustrated in the below section. As we can see there are multiple options that allow us to take into consideration certain quantitative elements that will affect the map. All of them pertain to the US. Observe the following two screenshots.
Step 19: When we select a suitable value for the Layer option, the “By” and “Using” section activate. By option essentially means how the layer needs to be incorporated. Select the appropriate value for this option.
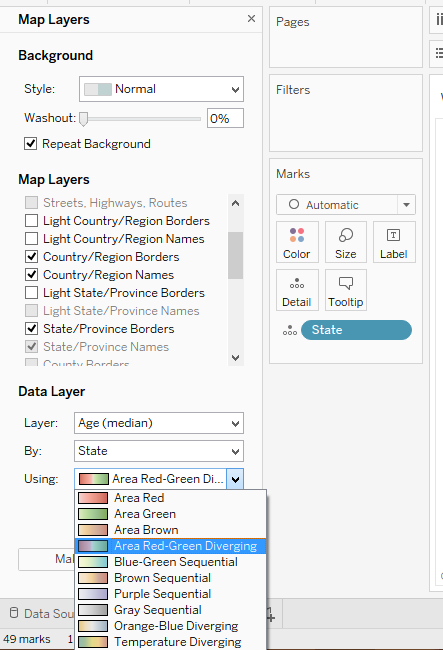
Step 20: Last but not least, the Using option allows us to select the color combination which is very crucial. The color combinations taking into consideration the value in the Layer option generates a powerful map-based visualization. Make an appropriate selection here.
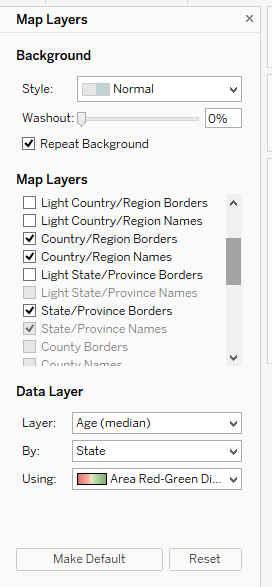
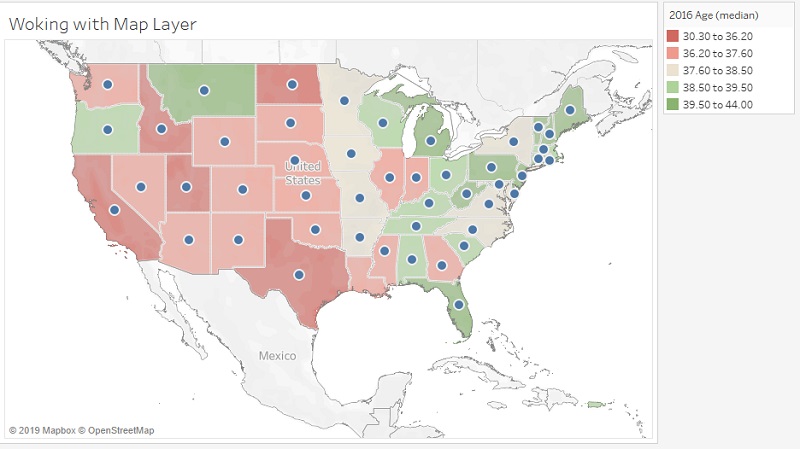
- Using the above steps we made selections in the Data Layer as follows. Now, just observe the map-based visualization that we got as shown by the screenshot subsequent to the below one. It offers a quick insight into the Age figures across the US.
Conclusion
Map Layers are those feature provided by Tableau that renders its map-based visualization feature a dynamic character. The options must be explored in detail before reaching the final combination, and the selection of values for various options should be based on the context.
Recommended Articles
This is a guide to Map Layers in Tableau. Here we discuss working with Map Layers in Tableau, in simple steps and proper explanation for better understanding. You can also go through our other related articles to learn more –
