Updated March 20, 2023
Introduction to Data Blending in Tableau
A feature that clearly depicts the versatile character of Tableau is Data Blending. Blending, in general, means combining. Often data is stored in multiple tables at different levels. In database terminology, we can say having the same data in multiple tables but with different granularities. E.g., a table contains distribution volume at the regional level, while another table has distribution volume at the divisional level. The tables will have certain fields in common. Sometimes, we may need fields from both tables for analysis. In such cases, the concept of data blending offers an easy solution to combine data from different data sources.
Need for Data Blending in Tableau
In Tableau, data blending refers to combining data. The crucial aspect of data blending is that it combines the tables at the view level without actually performing a join between the tables. Because Tableau is essentially a visual analytics tool, and that not every time, there may be the need to join the tables. Moreover, the combination happens sheet-wise and not workbook-wise. This ensures the view level combining features of data blending.
Blending Data in Tableau
Now, we will see how to blend data in Tableau. For our demonstration, we are considering distribution data. Two different tables contain data pertaining to distribution volume. They are present in two different Excel files. One table contains data at the Distribution Channel level, while the other contains the distribution unit level. A couple of fields are common in the two tables, though they exist with different names.
Following is the step-by-step procedure to perform data blending in Tableau and to use the combined data.
Step 1:
Loading data from two tables one by one.
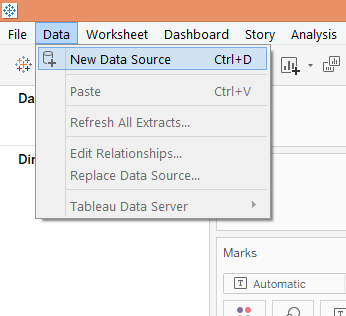
- In Data Menu, click on the New Data Source option, select the required source and load it into Tableau.
Perform the above step twice to load both the tables into Tableau. They shall appear under the Data tab as shown in the following screenshot.
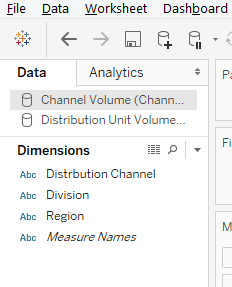
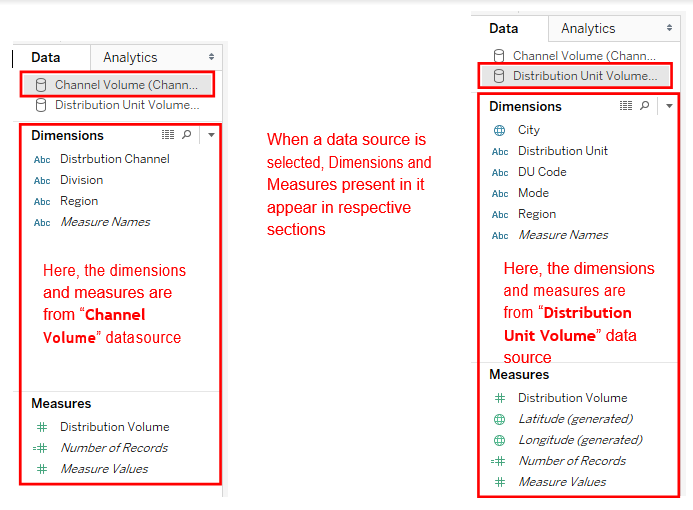
- Once loaded, both the sources will appear under the Data tab.
Step 2:
For blending data, we will perform the following steps:
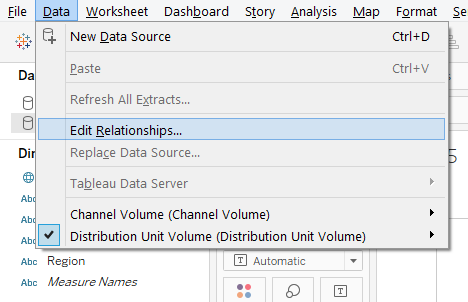
- Click on “Edit Relationships…” in the Data menu. It will pop up the Relationships dialogue box.
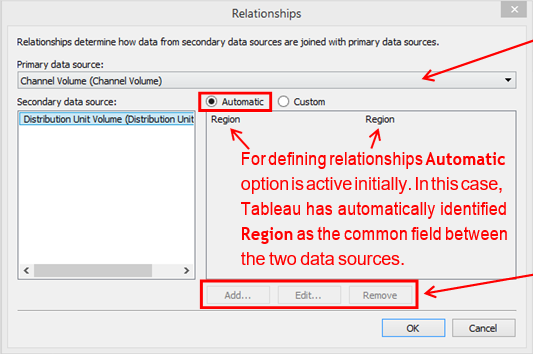
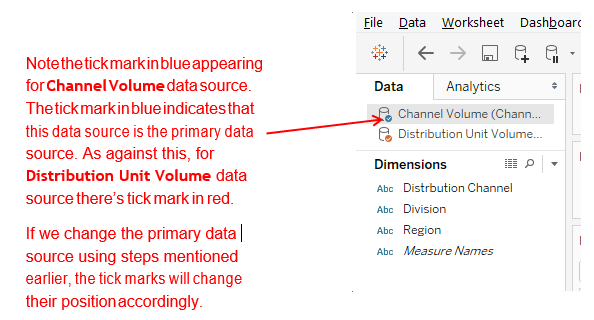
- By default, the currently selected data source becomes the primary data source.
- However, we can select the requisite primary data source from the drop-down menu.
- When the Automatic option is selected, these options are not active.
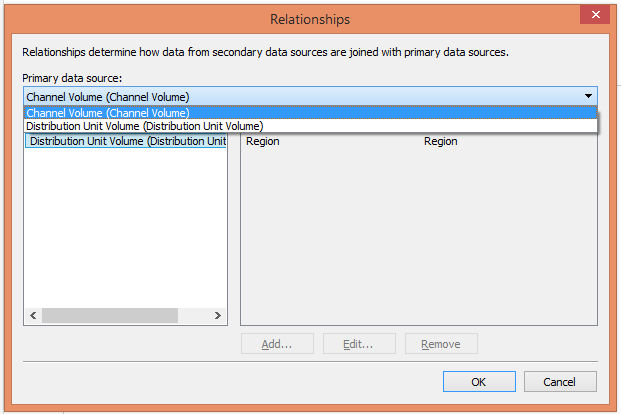
- The requisite primary data source can be selected from the drop-down menu.
- Click on OK after selecting the requisite data source as the primary data source.
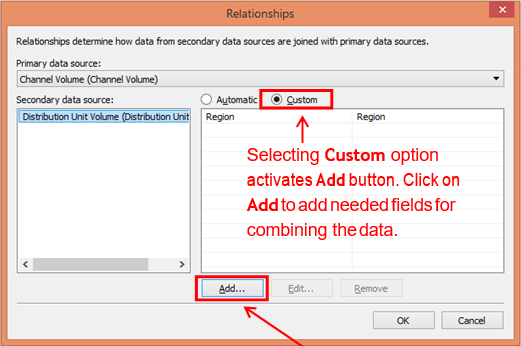
- Clicking on Add button pops up Add/Edit Field Mapping dialogue box.
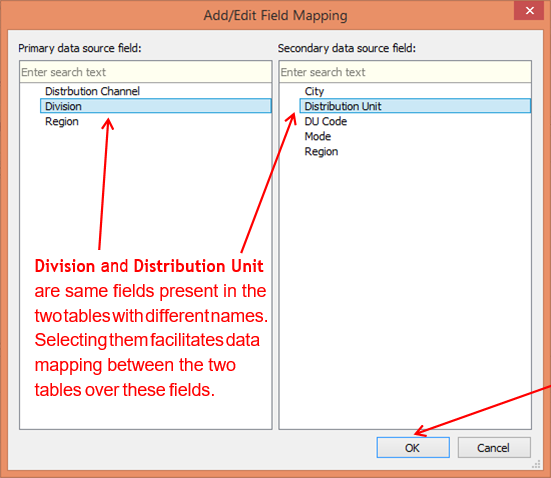
- Using Add/Edit Field Mapping, we can add custom fields for mapping data between the two data sources.
- Click on OK once requisite selections from the two sections, i.e. Primary and Secondary data source fields, are made.
Step 3:
Once the above steps are performed, we will check if the blending is successful or not by using appropriate dimensions from both tables.
Step 4:
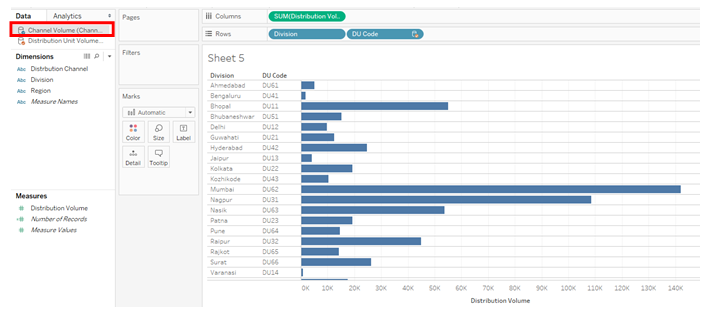
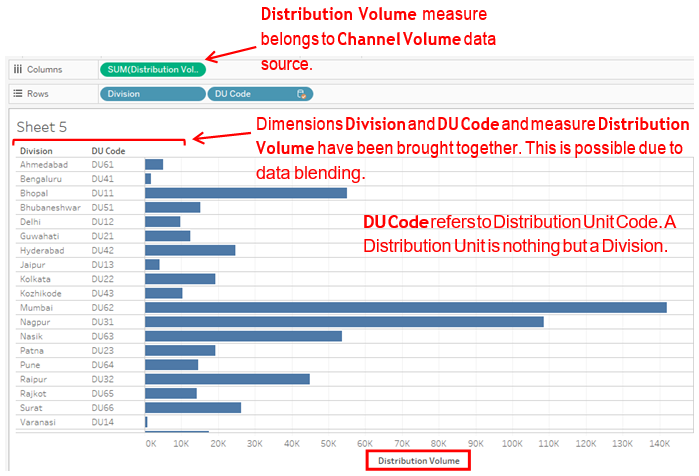
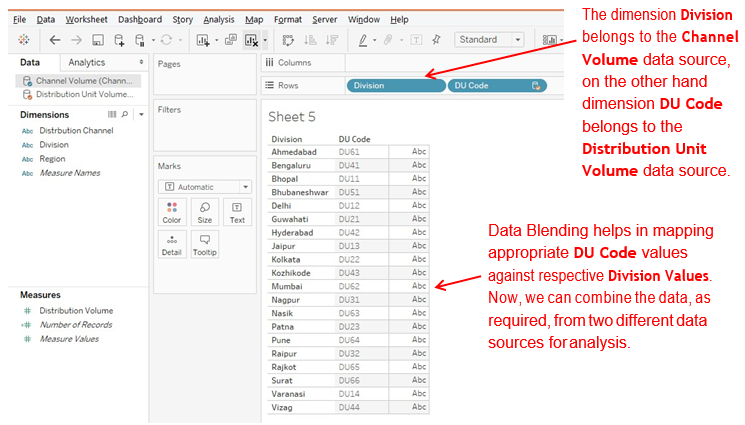
The above graphical analysis shows Division wise Distribution Volume for a product. While Distribution Volume is a numeric field present in both the tables with the same name, Division is present in the secondary data source, i.e. Distribution Unit Volume table as Distribution Unit field. Through data blending operation, we have combined the two tables and mapped the values. So, in the graph, we could see DU Code values against respective divisions. Not performing data blending would have generated blanks for the DU Code field.
Step 5:
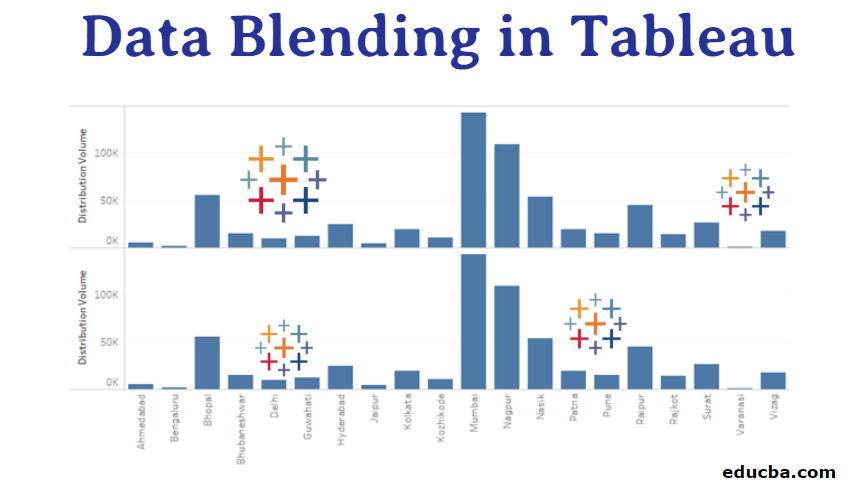
Both the tables contain distribution volume data, but only at different levels, so division-wise volumes for both the tables should be the same and the total volume. Let’s verify this.
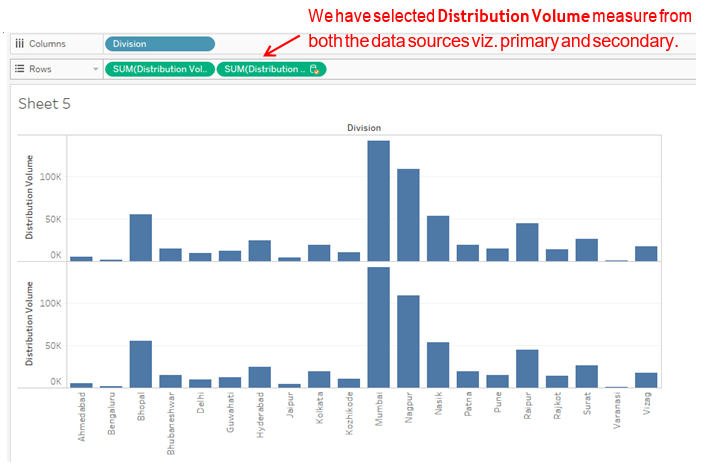
Note, as seen above, both the graphs depict the same pattern for Division wise Distribution Volume, though the measure has been selected from both primary as well as secondary data sources. This shows that though present at different levels in different tables, the Distribution Volume will remain the same. This is another proof of correct data blending facilitated by mapping over appropriate fields.
Conclusion
Data Blending is a simple and fast way to combine data from multiple sources in Tableau. It doesn’t actually join the tables, though it can be compared to Left Join, treating the primary data source as the left table. It just combines data at the view level to facilitate detailed graphical analysis.
Recommended Articles
This is a guide to Data Blending in Tableau. Here we discuss the basic concept with a step-by-step procedure to perform data blending in Tableau. You may also look at the following article to learn more –
