Updated April 26, 2023

Introduction to Create Set in Tableau
Tableau is a Business Intelligence tool for visually analyzing the data. Everything we do is increasingly contributing to huge amounts of data which can be leveraged by organizations to increase their business. Tableau products are transforming the way people use data to solve the problems. Tableau Software is the global leader in rapid-fire business intelligence software. Tableau is revolutionizing the way data is being used. Tableau is used by businesses, academic researchers, and many government organizations for visual data analysis. Tableau can connect to files, relational and Big Data sources to acquire and process data.
Set Overview
Set are custom fields that are created within Tableau Desktop based on dimensions from your data source. Tableau uses filters, groups and set to organize data. Set can be thought of as custom segments, but unlike dimension fields, they are always binary. Tableau Set is a custom filed used to hold the subset of data based on some condition. Tableau set allows you to isolate specific segments of a dimension, and can then be used in several different ways to find insights into your data. Set in Tableau are used to create subsets of data based on certain conditions defined by the user.
What is Set about?
- Set are subsets of your data, which can be created manually or computed. Either dimensions or measures can be used to determine what is included or excluded from a set using conditional logic. Set can be created for having a subset data of top 10 customers with the highest sales.
- You can pick individual dimension members to place in a set, have set be based on quantitative thresholds, created with the top or bottom performing dimension members, and more. There are certain use cases of a set. Some of these use cases include highlighting data that meets certain criteria, examining manually selected members of a dimension, comparing and contrasting members in the set vs. those that are not (IN/OUT), creating a combined set and much more.
- In real-time Tableau, Set can be created by selecting members from a list or By writing custom Condition or Selecting Top or Bottom few records based on Measure value so on.
- Within Tableau, the icon for a set is represented by a small Venn diagram (two interlocking rings). Set are also included in Tableau data sources (*.tds files), Tableau data extracts (*.tde files) and packaged Tableau data sources (*.tdsx).
How to create Set in Tableau?
Let us see how to create Set in Tableau:-
1. Static Set
It is a very easy and straight-forward method to create a static set in a tableau. There are different ways – a user can create a set in tableau. As shown on the below image – I am using the sum of Sales in Column field and Customer Name on Rows. I am using default data – Superstore data set provided by Tableau.
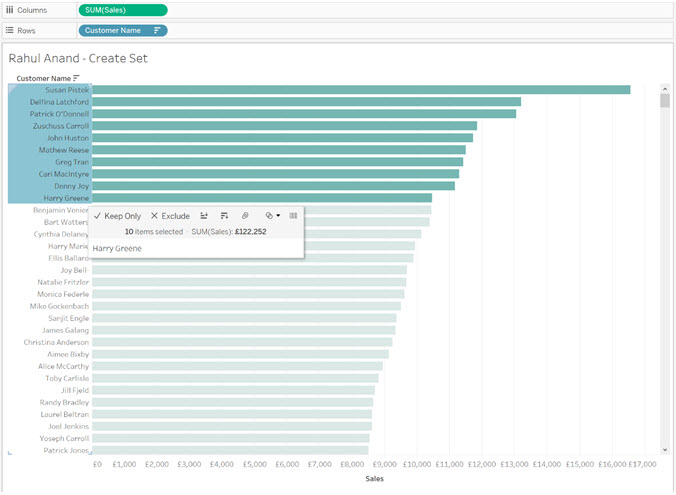
- I have arranged data in order of a customer with the highest sales.
- I have selected the Top 10 Customer Name
- Right-click and create set on the icon shown as a small Venn diagram
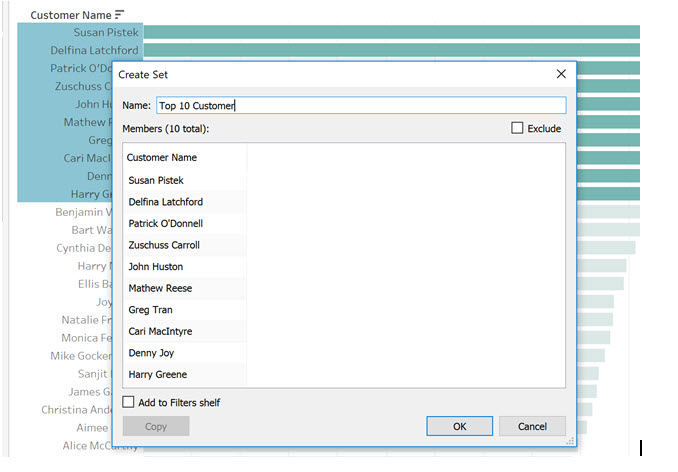
- I have given Name Top 10 Customer as a set name and clicked on OK.
- As shown in the below diagram – You can see, I have created set of Top 10 Customer. The set will appear on the Set Shelf on the left-hand side of the panel.
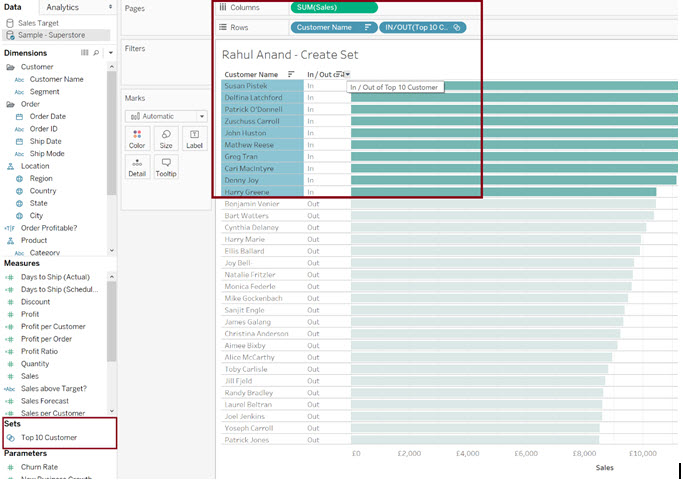
This set tells us whether each customer name is in or out of the top 10 customers by sales. This set is available to use our analysis. This set created is static in nature, it means when a new customer enters to top 10, it will not dynamically change.
2. Dynamic Set
You can create a dynamic set. It means a dynamic set allows you to change value when the data set is getting updated. Below are the steps to create a dynamic set:
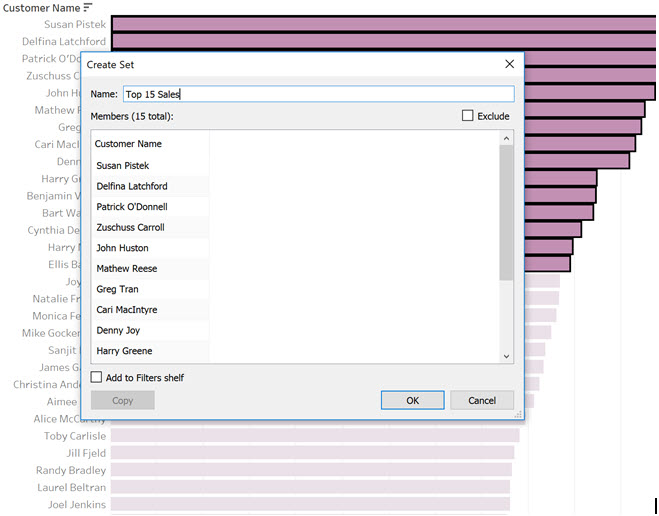
1. You can select dimension as shown below, I have selected the top 15 sales value. Right-click and create set on the icon shown as a small Venn diagram
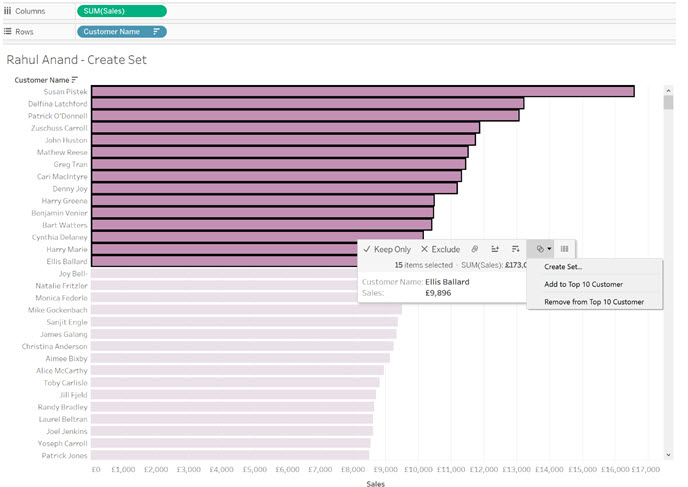 2. I have given Name Top 15 Sales as a set name and clicked on OK.
3. As shown in below diagram – You can see, I have created set of Top 15 Sales. The set will appear on the Set Shelf on the left-hand side of the panel.
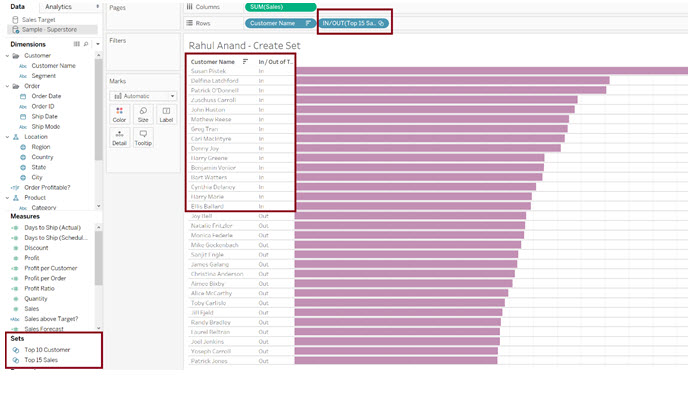
Dynamic set like above will dynamically update their data when their values of sales are updating. A dynamic set is good for real-time analysis.
5 Ways to use Set
There are five ways to use the set.
- You can use set as a filter. Since sets are binary, you can add them as a filter. You can use using by right-clicking on a set from the Set Shelf and choosing Show Filters.
- You can use set as encode marks. It can be done by dragging the set from the Set Shelf to the color mark card.
- You can use set as a calculated field. It can be used like dimensions and measures.
- You can use set as dimension fields. It can be done by adding fields to the column shelf or row shelf, the view will be sliced and diced by that dimension field.
- You can sue set as a Custom hierarchy. It allows you and ends users to easily drill won and back up across different dimensions.
Filter: Filters can even use with logical conditions on measures or dimensions to modify the subset of data that is returned. This seems much more in line with the functionality of a set than what we saw from a group.
Groups: Groups are used to simplify a visualization that is using a dimension with a large membership. Groups must be created within a dimension. Simplifies large numbers of dimension members by combining them into higher-level categories.
Examples for Creating Set in Tableau
In these examples, we are going to consider the superstore sales data which is available on the tableau’s website
Example#1 – Creating a Set as a filter
We will be getting the excel file into tableau using import using excel.
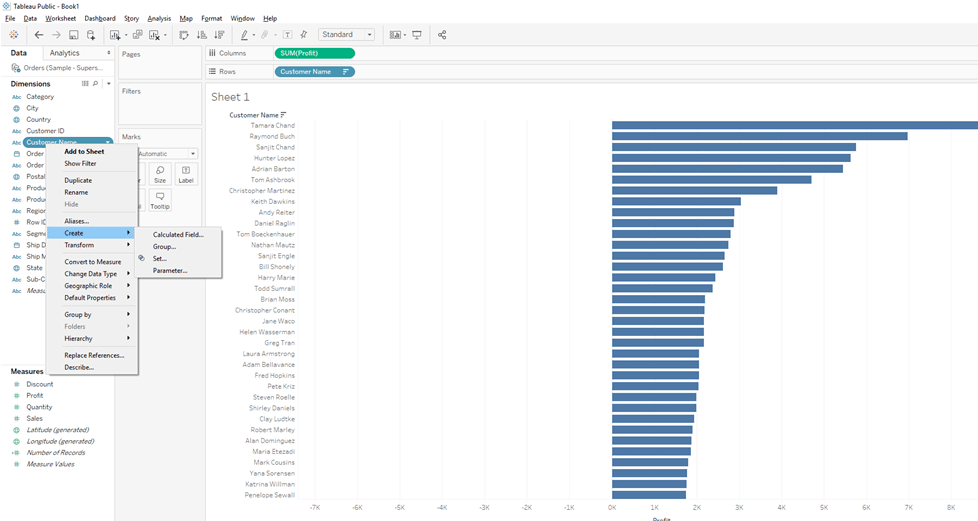
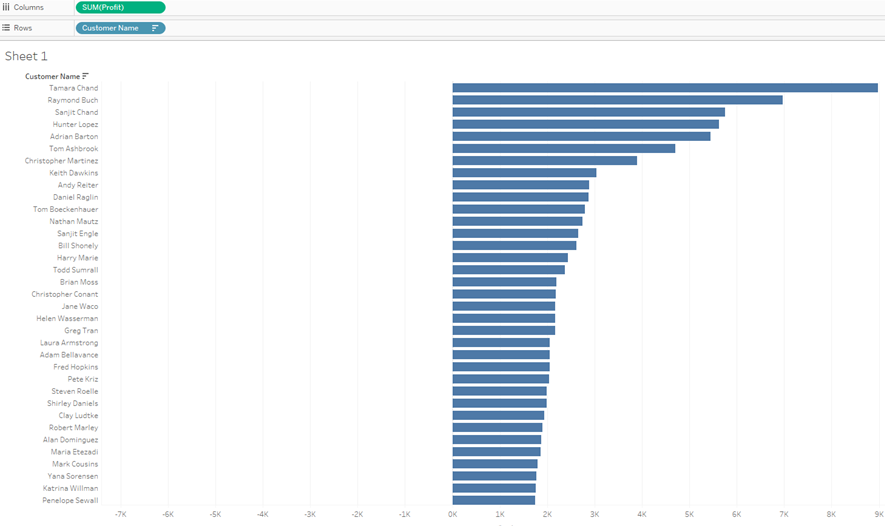
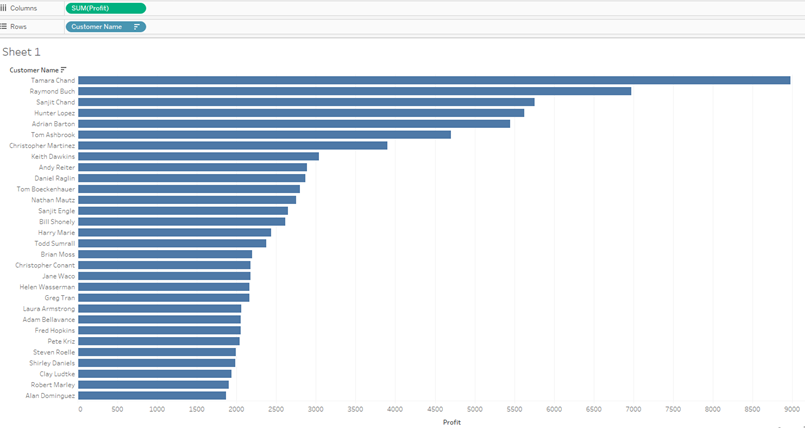
Now we have taken the measure (Profit) in columns and the dimension (customer name) in rows and have got the following result.
Now for creating a Set in a tableau, we have to do the following:
Right-click on customer name and then click on a Create a Set.
(Note: Sets are often anchored to dimensions)
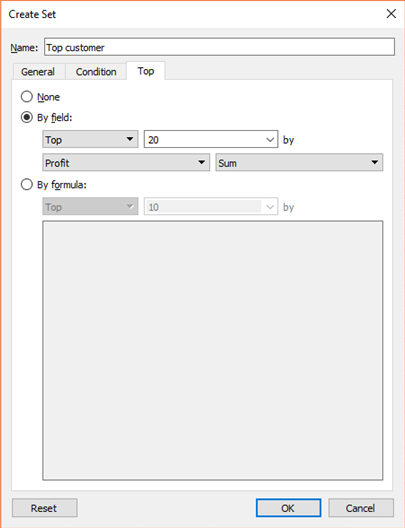
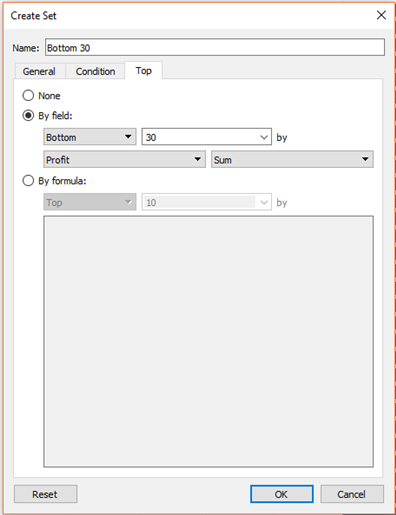
After selecting the create set option a dialogue box will open up. Three tabs the last one being Top, the easiest one among all and we rename the set as a Top customer.
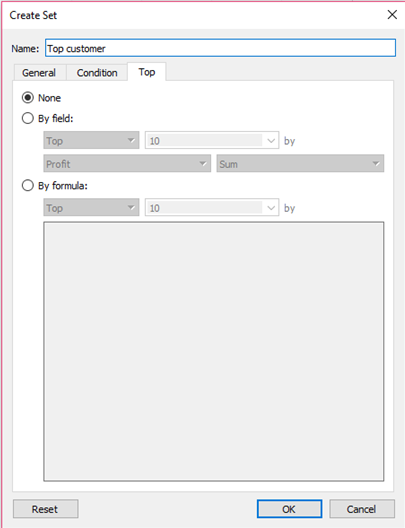
Now we will select the option a By field and select profit and sum and enter 30 as input.
So now we can see that a new partition is created along with measures and dimensions a new tab appears as Sets.
Now if we drop the set in the filters pane we get the list of the top 30 customers in the data.
Example #2 – Creating a Set as IN/OUT field
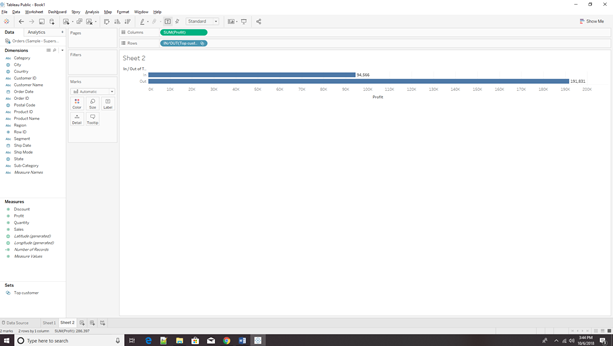
Now remove take a new sheet and place the measured profit in the column field and now place the set named top customer in the rows field then we will have the below image.
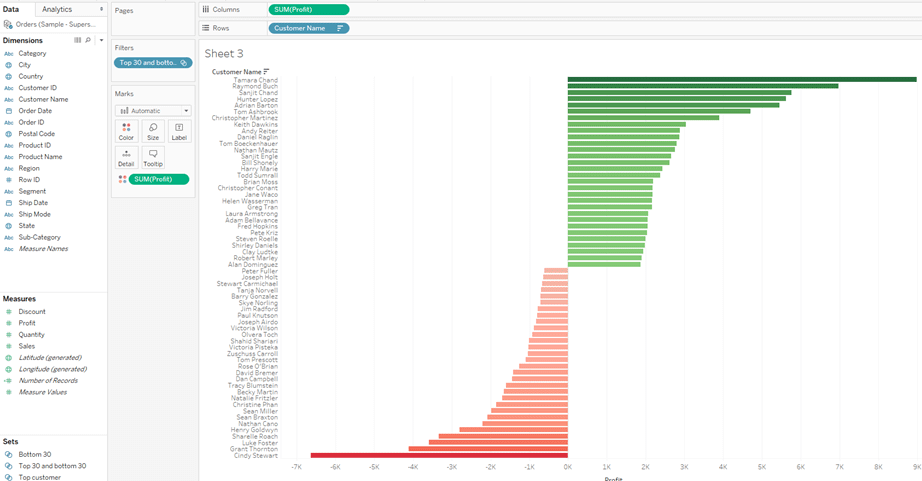
Now a question may arise that what if we want to see the top 30 and bottom 30 together with the same sheet and not on two different sheets.
Example #3 – Showing both the top 30 and bottom 30
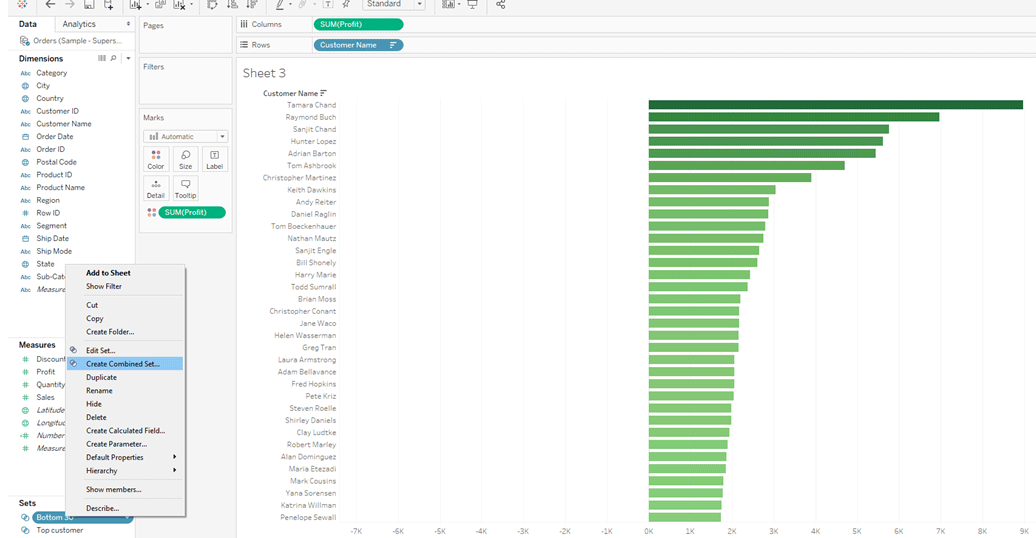
For this scenario, we select the bottom and also, we are adding a color variance just to have a good look between the top 30 and bottom 30 customers.
Now we have to click on a set and select a combined set.
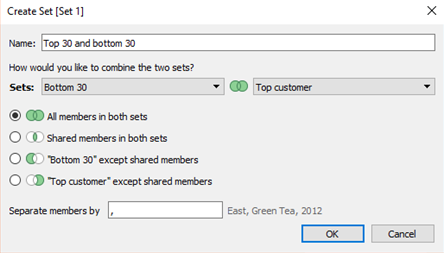
A dialogue box will pop up, we will be renaming the name as “Top 30 and bottom 30 customers”.
We are given four options to select and if you are comfortable with databases then these options are similar to those of the four joins which are used in the database, namely:
- Full join
- Inner join
- Left join
- Right join
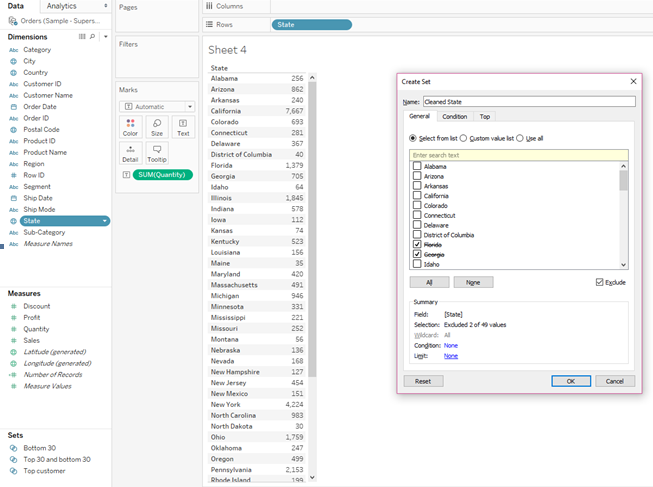
One of the best use case scenario of sets being to be able to be used as tools to clean up your data. Here we are considering the dimension (state) and are looking for the number of units that are sold in the state.
Sometimes we would like to remove some data from the dataset (which can also be called as subsetting the data ) and for that, we here right-click on state à delete exclude à and then again select the states which need to be removed
Here we are excluding the states Florida and Georgia.
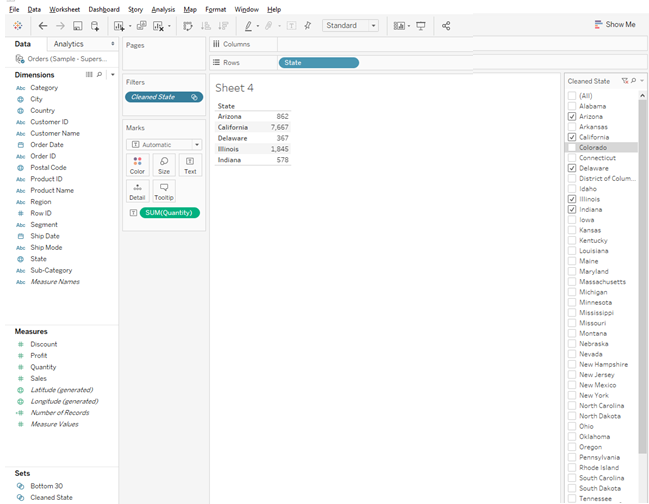
After creating a set in Tableau named cleaned state we will drag and drop that field in the filter pane of the sheet.
Right-click on the filter pane above Cleaned state à and select show filters.
Now we can see that the filter does not contain the two states which were excluded (Georgia and Florida)
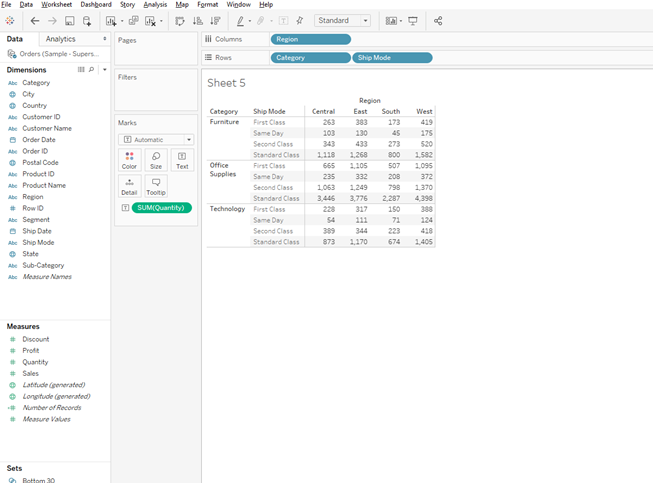
Many times we would like to combine two or more fields to subset the dataset and hence the below example shows how to subset from selecting from two-three dimensions.
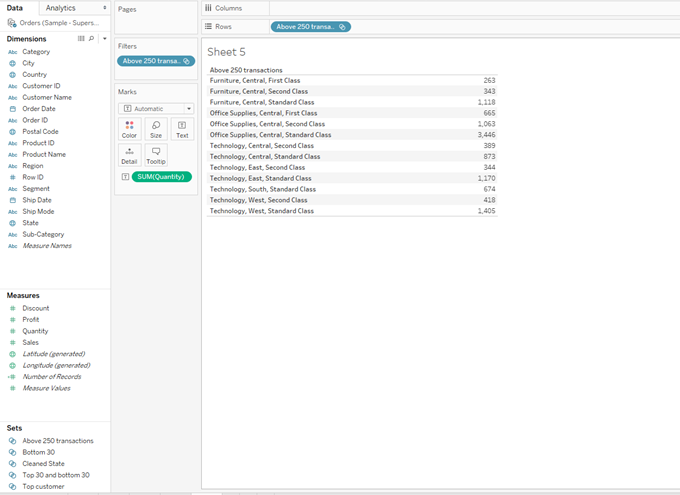
Here we are considering three dimensions namely State, Ship mode and Category and we are taking the measure as quantity into consideration.
Please place the dimensions and measures as shown in the below figures.
Now for the data to be used as a customized filter select all the values above 250 by pressing down the control key and select create set as shown below.
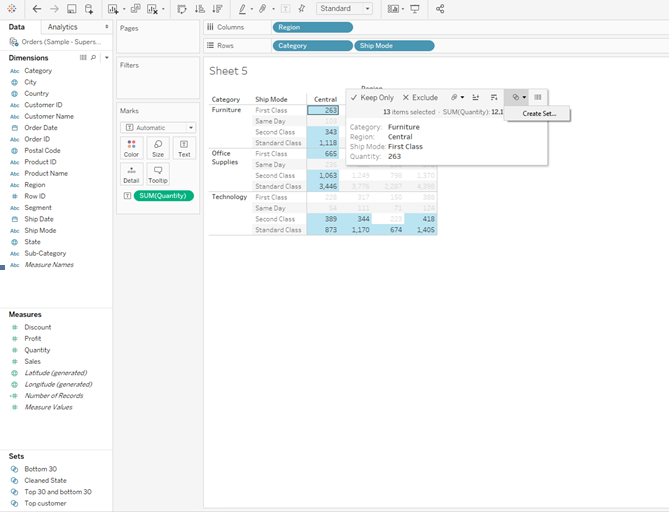
Once the settings dialogue box pops up to rename the set as “Above 250 transactions” and remove all dimensions and measures and pull out the set named Above 250 transactions from the Set tab which is located at the left bottom side of the sheet.
Conclusion
In this, we have analyzed Tableau: How to create a Set and Tableau which is one of the advanced BI Tools. Tableau is primarily used to create a story from your data. Tableau is used for creating reports and interactive dashboards. It is mostly used for data visualizations and creating trends in data. Tableau is self-service drag and drop tools for Business Intelligence. Tableau can be used for simple statistical analytics.
Recommended Articles
This has been a guide to Create Set in Tableau. Here we have discussed basic concept, how to create set and ways to use it along with examples. You may also have a look at the following articles to learn more –
