Updated March 24, 2023

Introduction to Tableau Fixed Function
Tableau fixed function is used to aggregate the values present at dimensions only in the specified calculation field. The fixed-function does not take the view into consideration while the aggregating value for category type values. A fixed view is created refereeing to dimensions existing in the current view. Fixed calculations are on the top priority for the order operation. This will provide the level of details of the dimensions. It is not depending on what visualization we have in the tableau or we don’t have in the tableau. We can simply fix the level of details we want to display in the tableau.
Syntax
The subject is nothing but the dimensions aggregation, the sum of the value. It is the group by sum or sum of the value.
{FIXED [Subject] : [Q1 %] }
Select the subject and Q1 % is the SUM of the group by subject.
Data is aggregated at a different level and fixed value changes as per the values or data changes. The calculation field is important while aggregating values.
How to Use Tableau Fixed Function?
- Start Tableau Public or Desktop edition.
- Drag superstore datasheet or you can add data sheet as per your choice (you can download sample datasheet from tableau official site).
- Click on connect to data to open datasheet.
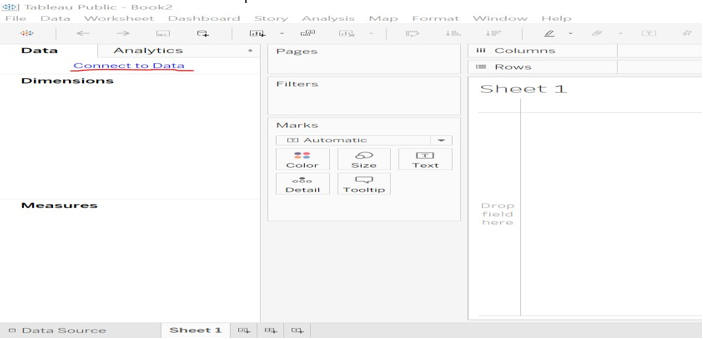
- Click on text file open->open file from your computer.
- The below image will appear.
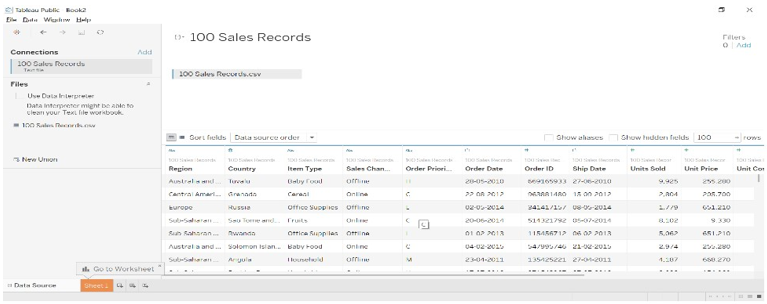
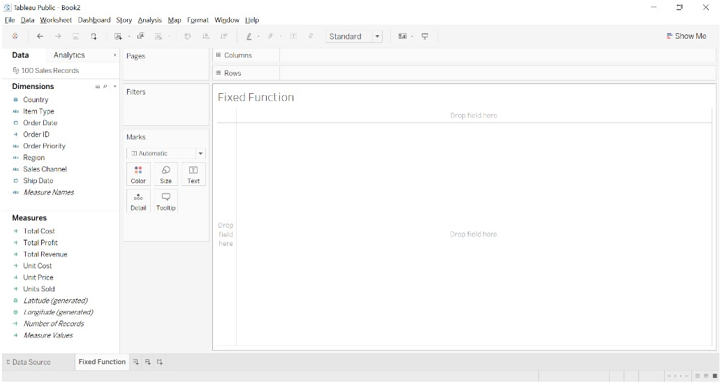
- Go to sheet 1, data gets allocated into Dimensions and Measures. You can observe into the below dimensions (qualitative) like country, item type a measure (quantity) like unit cost and unit sold, etc.
The FIXED function is used for finding specific value for the category.
- Go to the down arrow at dimension-> click on create a calculated field.
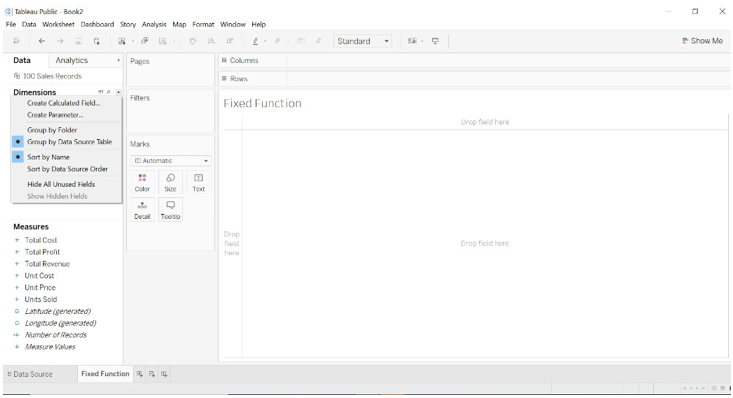
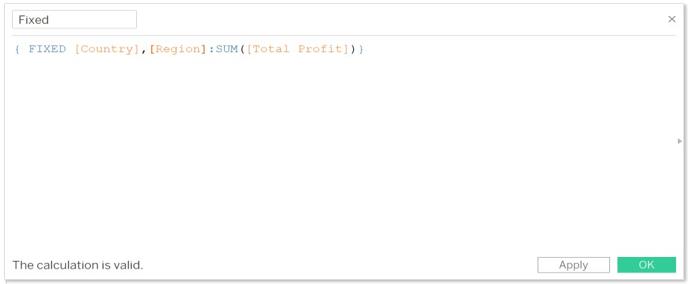
- Type calculation formula we want. To aggregating the values.
{ FIXED [Country],[Region]:SUM([Total Profit])}
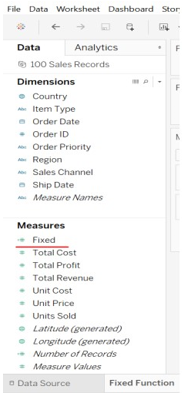
- We can see a Fixed calculated field in the measures.
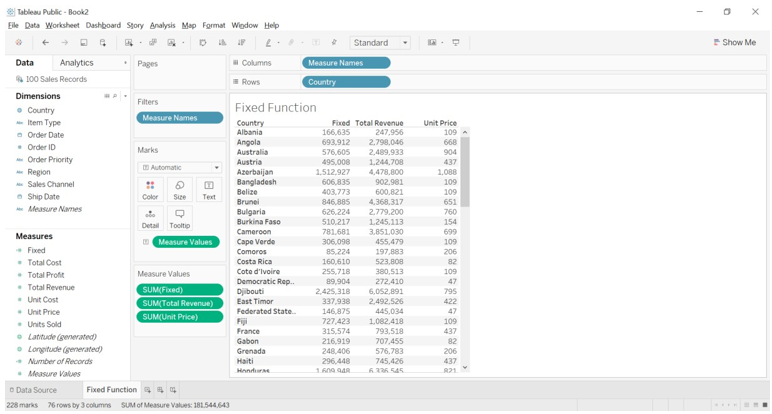
- Drag Measure names into columns and country into rows, measure names into filters, measure values into Text filter. You can see the fixed value for each country. Each fixed value is identical for each country.
Example of Tableau Fixed Function
We will find out the sum of sales as per the region, we are referring to sample superstore data file. We have downloaded from Tableau Community forum.
Sum of sales as per region
- Download the sample superstore file and save it to the computer.
- Open Tableau Public or desktop version.
- Open sample super store file from computer.
- When you click on Connect to data, you have shown multiple options to open the file you want.
- When you open a sample superstore file you will get to see three different databases.
- We have chosen the Orders table and drag it to the Data Source sheet.
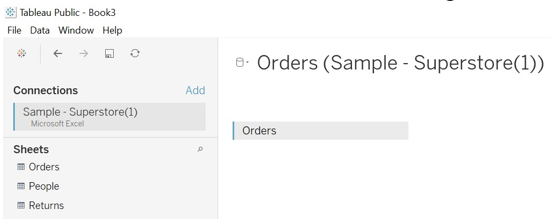
- We will get to see data arranged into different fields as per it is the data type.
- Go to sheet (I have given name as sales)
- Create a calculate filed named sum of sales and add details.
{FIXED [Region]:SUM([Sales])}
- Drag region and state dimensions to rows.
- Dra region to Color formatting option and Drag sum of sales to Text formatting option.
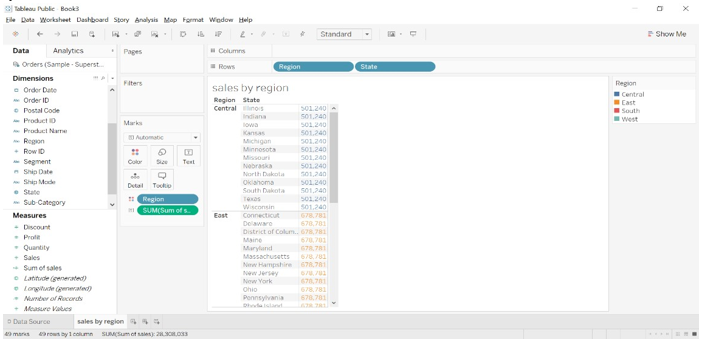
- We can observe in the above image, the sum of sales as per region is the same for a different state, that is value is fixed for all the state comes under the region.
- We can see that for the Central region the sum of the sale is 501204.
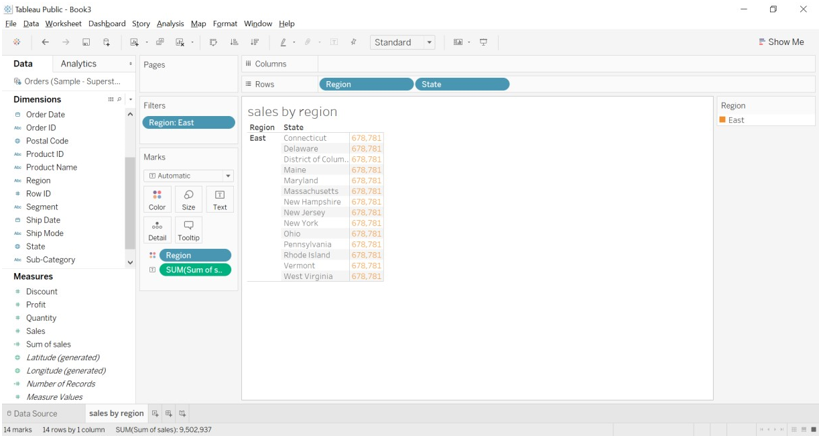
- We can filter the region by dragging the region to filter the formatting window.
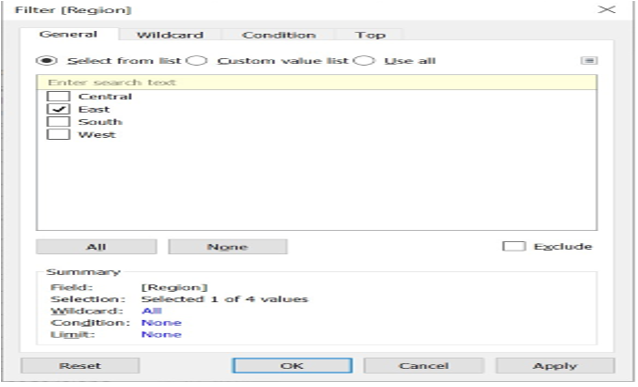
- We can see the sale as per the East region.
Sum of profit as per state with sub-category
- Create calculated field with details {FIXED [State]:SUM([Profit])}
- Drag State and sub-category to rows.
- State into color formatting option and profit by state into Text formatting option.
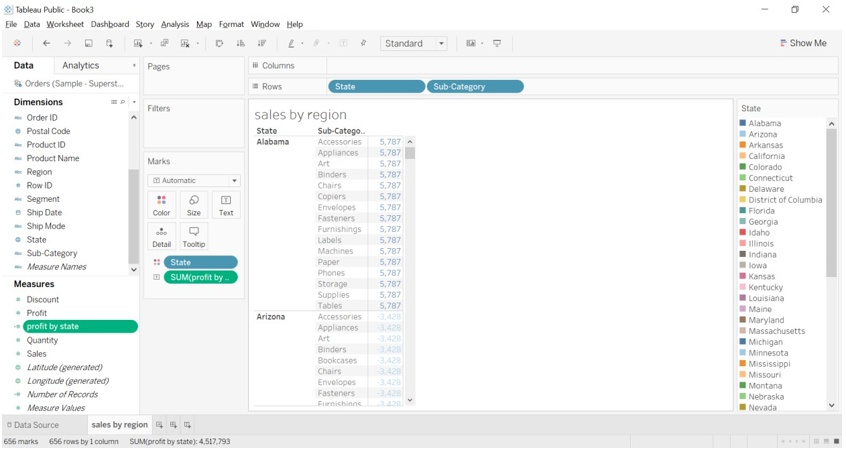
- We can observe that profit for sub-category like accessories, art, labels, phone, etc that comes under Alabama state is 5,787.
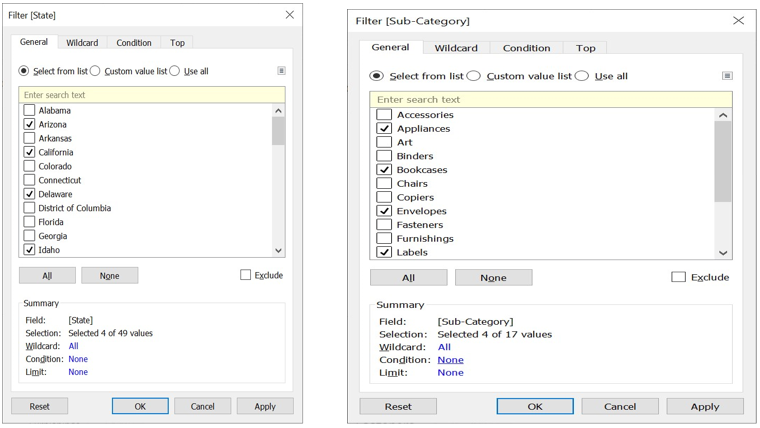
- We can observe that we have a large number of state and subcategory options available, we will add state and sub-category to Filters and select less number of states so that we can get to see the result about different state also.
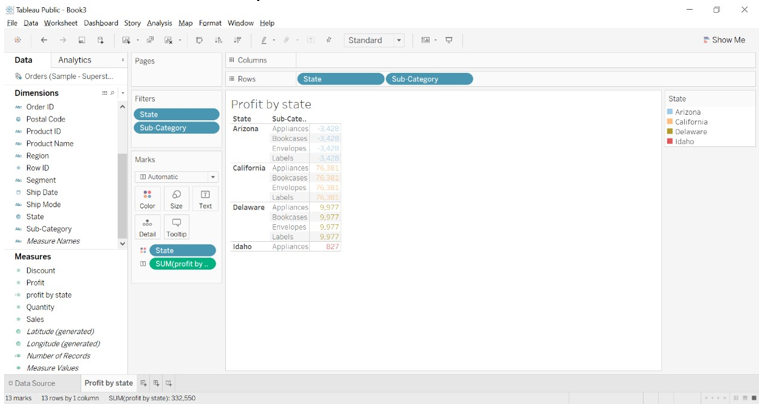
- We can observe in the below image, sub-category for each state and profit values. We are seeing limited sub-categories like Appliances, Bookcases, Envelopes, and Labels.
Conclusion
we have learned about FIXED function in tableau, as per the name of the function it works in the same way. We have seen some examples of fixed-function such as the sum of sales as per region and sum of profit as per state which shows us that fixed value will not change for different Fixed values given in the formula.
Recommended Articles
This is a guide to Tableau Fixed Function. Here we discuss How to Use Tableau Fixed Function along with the Examples. You may also have a look at the following articles to learn more –
