EDUCBA

EDUCBA

MENUMENU
  • Free Tutorials
  • Free Courses
  • Certification Courses
  • 360+ Courses All in One Bundle
  • Login

Window Sum Tableau

Home » Data Science » Data Science Tutorials » Tableau Tutorial » Window Sum Tableau

Window Sum Tableau

Introduction to Window Sum Tableau

Tableau has another finest function to do calculations. SUM is nothing but the total of the values presents in the block. Window SUM in tableau performs a total of the previous value, current value, and future value. It will perform aggregation of the first level row in the tableau sheet. We always need to create a calculated field for the calculations to be performed in the tableau. The syntax for this is – WINDOW SUM(), for these create calculated fields you can name anything you want. Windows in tableau offers different functions such as total, average, sum, etc. Windows SUM is one of them.

How does Windows Sum do in Tableau

I will explain the scenario with an example that how windows sum performs. Windows calculations perform Marks on the data.

Start Your Free Data Science Course

Hadoop, Data Science, Statistics & others

  1. Connect to tableau public or desktop
  2. Extract the database as per your choice or connect to it

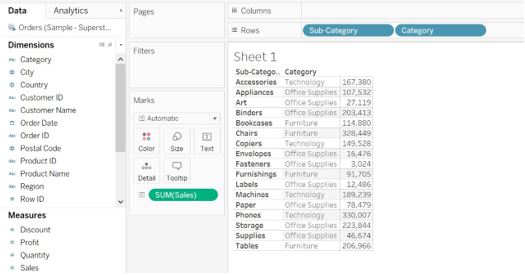
We have extracted the sample superstore database. From which I have extracted orders table to Tableau data source sheet.

    1. Drag category and sub-category dimension to
    2. Drag sales measure to Marks
    3. Create calculated field names as a
    4. Enter value as

WINDOW_SUM(SUM([Sales]),-1,0).

Sum(sales) measure we want to perform windows sum with, -1 is equal to the previous value and 0 is the current value.

  1. Win calculated field gets created at the Measure shelf.
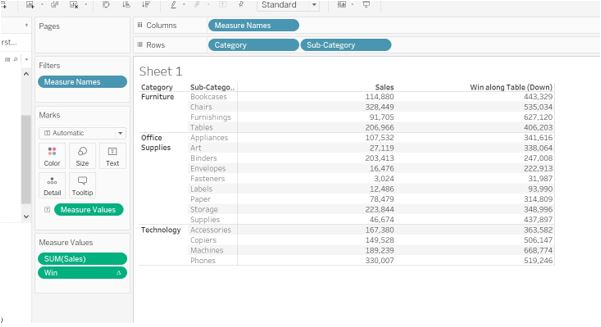
  2. Double click on the calculated field Win.

Windows sum

  •  We can observe in the below, when we double click on the Win measures, measure names get added to the Filters and columns

Sales and Win

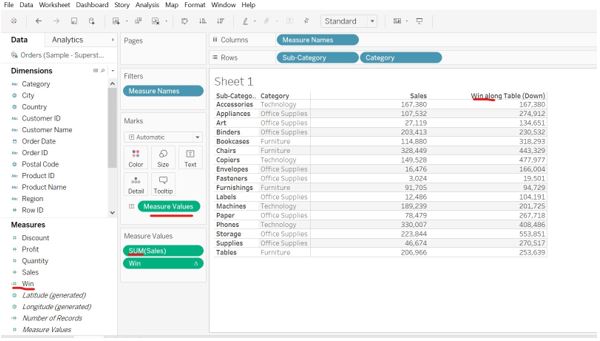
  • You can observe in the above image we have two columns, Sales and Win.

We will understand how the windows sum calculated field worked in the above example and how Win values are added to.

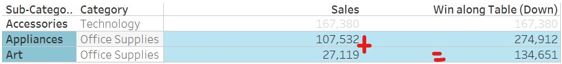
  • Look first at sales value is – 167380 and win value is 167380, both values are same because as per the formula (-1,0) -1 is 0 and 0 is 167380 and that is the reason sum is 167380 because we have no previous value is and current values is
  • Appliances Look at the next sales value is – 107532 and win value is 274912, the here previous value is 167380 and the current value is 107532 we have sum as 274912. (167380+107532=274912)

Window Sum Tableau3

  • Art SUM is 134651, the previous value is 107532 and the current value is 27119. (107532+27119=134651). We are aggregating the data of

Window Sum Tableau4

  1. Binders win is 230532, the previous value is 27119 and the current value is 203413. (27119+203413=230532) and keep on adding further numbers in the

Window Sum Tableau5

The current value is added to the previous and we get the sum of the window sales value for each category and sub-category.

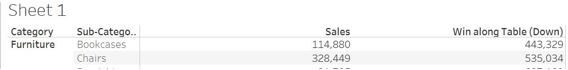
  • We will make a change in the category and sub-category position to have a better understanding. Move category first then sub-category.
  • You can see in the below image there is a change in the win values due to row values interchangeability.

Window Sum Tableau6

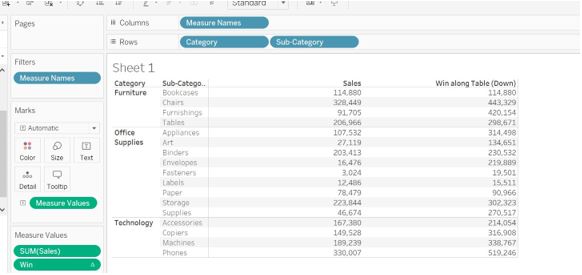
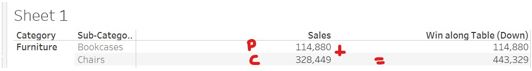
  • For category as furniture with sub-category as Chairs we get the win value as 443,329 (328449 + 114880 = 443,329) 328449 is current value and 114880 is previous

Window Sum Tableau7

  • Now we are going to change front and end value in the window_sum.Edit the window_sum with -1 and 1. -1 is the previous value and 1 is the next value.

Window Sum Tableau8

Window Sum Tableau9

  •  Window_sum will calculate the previous value, current value, and

Window_sum

  • For category as Furniture with bookcases category – win as 443,329, the previous value is 0, the current value is 114,880 and the next value is 328,449.

category

  • For Category as furniture with Chairs as Sub-category – win value is 535,034. Previous value is 114,880, current value is 328,449 and next value is 91,705 (114,880+328,449+91,705=535,034).

Sub-category

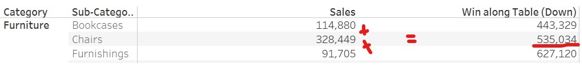
Window_sum function will add previous, current and next value. This way the whole sum is performed.

Conclusion

We have learned about one of the WINDOW functions in tableau. It is a great way to use for the calculations. We need to understand the front and end values mentioned in the formula. Creating a calculating field for the function is needed. The SUM function will sum up all the values in the row from the first value to the current value or next value.

Recommended Articles

This is a guide to Window Sum Tableau. Here we discuss the introduction to Window Sum Tableau, how does windows Sum do, scenario with examples. You can also go through our other related articles to learn more –

  1. Tableau Parameter Filter
  2. Tableau Calculated Field
  3. Tableau Window Functions
  4. Tableau Fixed Function

Tableau Training (4 Courses, 6+ Projects)

4 Online Courses

6 Hands-on Projects

39+ Hours

Verifiable Certificate of Completion

Lifetime Access

Learn More

0 Shares
Share
Tweet
Share
Primary Sidebar
Tableau Tutorial
  • Functions
    • Tableau Functions
    • Tableau String Functions
    • Concatenate in Tableau
    • Rank Function in Tableau
    • Tableau Aggregate Functions
    • Tableau Date Functions
    • Window Sum Tableau
    • LOD Expressions in Tableau
    • LOOKUP Function in Tableau
    • Tableau Fixed Function
    • Tableau Count Distinct
    • Tableau Window Functions
  • Basic
    • What is Tableau
    • What is Tableau Dashboard
    • What is Tableau Server
    • Uses of Tableau
    • Tableau Versions
    • Tableau Architecture
    • Is Tableau Free
    • Tableau New Features
    • How To Install Tableau
    • How to Use Tableau?
    • Install Tableau Server
    • Tableau Commands
  • Charts
    • Tableau Charts
    • Tableau Chart Types
    • Donut Chart in Tableau
    • Funnel Chart in Tableau
    • Gantt Chart in Tableau
    • Bubble Chart in Tableau
    • Pareto Chart in Tableau
    • Sankey Chart In Tableau
    • Stacked Bar Chart in Tableau
    • Tableau Bullet Chart
    • Waterfall Chart in Tableau
    • Line Chart in Tableau
    • Heat Map in Tableau
    • Histogram in Tableau
    • CrossTab in Tableau
    • Treemap in Tableau
    • Trend Lines in Tableau
    • Tableau Reference Lines
    • Tableau Dual Axis
    • Legend in Tableau
    • Pie Chart in Tableau
    • Tableau Storyline
  • Statement
    • Tableau IF Statement
    • Case Statement in Tableau
  • Sort/Filters
    • Sorting in Tableau
    • Filters in Tableau
    • Types of Filters in Tableau
    • Tableau Action Filter
    • Context Filter in Tableau
    • Tableau Parameter Filter
    • Adding Filters in Tableau Dashboard
    • Tableau Context Filter
  • Tableau Dashboard
    • Dashboard in Tableau
    • Tableau Dashboard Creation
    • Tableau Dashboard Design
    • Tableau Workbook
  • Advanced
    • Tableau Reporting
    • Tableau Reporting Tool
    • Conditional Formatting in Tableau
    • Data Blending in Tableau
    • Parameters in Tableau
    • Tableau Data Sets
    • Tableau Drill Down
    • Tableau Dynamic Parameters
    • Tableau Table Calculation
    • Tableau Visualization
    • Tableau Joins
    • Pivot in Tableau
    • Data Visualization With Tableau
    • Forecast in Tableau
    • Map Layers in Tableau
    • Group in Tableau
    • Tableau Group by
    • Hierarchy in Tableau
    • Sets in Tableau
    • How to create a Set in Tableau
    • Tableau Order of Operations
    • Tableau User Group
    • Tableau Calculated Field
    • Custom SQL in Tableau
  • Interview Questions
    • Tableau Interview Questions

Related Courses

Tableau Certification Course

Business Intelligence Courses

Data Visualization Courses

Footer
About Us
  • Blog
  • Who is EDUCBA?
  • Sign Up
  • Corporate Training
  • Certificate from Top Institutions
  • Contact Us
  • Verifiable Certificate
  • Reviews
  • Terms and Conditions
  • Privacy Policy
  •  
Apps
  • iPhone & iPad
  • Android
Resources
  • Free Courses
  • Database Management
  • Machine Learning
  • All Tutorials
Certification Courses
  • All Courses
  • Data Science Course - All in One Bundle
  • Machine Learning Course
  • Hadoop Certification Training
  • Cloud Computing Training Course
  • R Programming Course
  • AWS Training Course
  • SAS Training Course

© 2020 - EDUCBA. ALL RIGHTS RESERVED. THE CERTIFICATION NAMES ARE THE TRADEMARKS OF THEIR RESPECTIVE OWNERS.

EDUCBA
Free Data Science Course

Hadoop, Data Science, Statistics & others

*Please provide your correct email id. Login details for this Free course will be emailed to you
Book Your One Instructor : One Learner Free Class

Let’s Get Started

This website or its third-party tools use cookies, which are necessary to its functioning and required to achieve the purposes illustrated in the cookie policy. By closing this banner, scrolling this page, clicking a link or continuing to browse otherwise, you agree to our Privacy Policy

EDUCBA

*Please provide your correct email id. Login details for this Free course will be emailed to you
EDUCBA Login

Forgot Password?

EDUCBA
Free Data Science Course

Hadoop, Data Science, Statistics & others

*Please provide your correct email id. Login details for this Free course will be emailed to you