EDUCBA

EDUCBA

MENUMENU
  • Free Tutorials
  • Free Courses
  • Certification Courses
  • 360+ Courses All in One Bundle
  • Login
Home Data Science Data Science Tutorials Tableau Tutorial Tableau Joins
Secondary Sidebar
Tableau Tutorial
  • Advanced
    • Tableau Bins
    • Tableau 3D
    • Tableau Export to Excel
    • Tableau Reporting
    • Tableau Reader
    • Tableau Map
    • Tableau Viewer
    • Tableau Prep Builder
    • Tableau Bridge
    • Tableau Tooltip
    • Tableau Hyper
    • Tableau Zen Master
    • Tableau Union
    • Tableau Templates
    • Tableau Alerts
    • Tableau Reporting Tool
    • Conditional Formatting in Tableau
    • Tableau Web Data Connector
    • Tableau BI Tool
    • Data Blending in Tableau
    • Parameters in Tableau
    • Tableau Data Sets
    • Creating Set in Tableau
    • Tableau Drill Down
    • Tableau Dynamic Parameters
    • Tableau Table Calculation
    • Tableau Visualization
    • Tableau Joins
    • Pivot in Tableau
    • Data Visualization With Tableau
    • Forecast in Tableau
    • Map Layers in Tableau
    • Group in Tableau
    • Tableau Group by
    • Hierarchy in Tableau
    • Sets in Tableau
    • How to create a Set in Tableau
    • Tableau Order of Operations
    • Tableau User Group
    • Tableau Calculated Field
    • Custom SQL in Tableau
  • Basic
    • What is Tableau
    • What is Tableau Dashboard
    • What is Tableau Server
    • Uses of Tableau
    • Tableau Versions
    • Tableau Architecture
    • Is Tableau Free
    • Tableau New Features
    • How To Install Tableau
    • How to Use Tableau?
    • Install Tableau Server
    • Tableau Commands
  • Charts
    • Tableau Charts
    • Tableau Bar Chart
    • Tableau Chart Types
    • Donut Chart in Tableau
    • Tableau Gauge Chart
    • Funnel Chart in Tableau
    • Gantt Chart in Tableau
    • Bubble Chart in Tableau
    • Pareto Chart in Tableau
    • Sankey Chart In Tableau
    • Stacked Bar Chart in Tableau
    • Tableau Bullet Chart
    • Waterfall Chart in Tableau
    • Line Chart in Tableau
    • Heat Map in Tableau
    • Histogram in Tableau
    • CrossTab in Tableau
    • Treemap in Tableau
    • Trend Lines in Tableau
    • Tableau Reference Lines
    • Tableau Dual Axis
    • Legend in Tableau
    • Pie Chart in Tableau
    • Tableau Storyline
  • Statement
    • Tableau IF Statement
    • Case Statement in Tableau
  • Functions
    • Tableau Functions
    • Tableau String Functions
    • Concatenate in Tableau
    • Rank Function in Tableau
    • Tableau Aggregate Functions
    • Window Sum Tableau
    • LOD Expressions in Tableau
    • LOOKUP Function in Tableau
    • Tableau Fixed Function
    • Tableau Count Distinct
    • Tableau Window Functions
  • Sort/Filters
    • Sorting in Tableau
    • Filters in Tableau
    • Types of Filters in Tableau
    • Tableau Action Filter
    • Context Filter in Tableau
    • Tableau Parameter Filter
    • Adding Filters in Tableau Dashboard
    • Tableau Context Filter
  • Tableau Dashboard
    • Dashboard in Tableau
    • Tableau Dashboard Examples
    • Tableau Dashboard Creation
    • Tableau Dashboard Design
    • Tableau Workbook
  • Interview Questions
    • Tableau Interview Questions

Related Courses

Tableau Certification Course

Business Intelligence Courses

Data Visualization Courses

Tableau Joins

By Priya PedamkarPriya Pedamkar

Tableau joins

Introduction to Tableau Joins

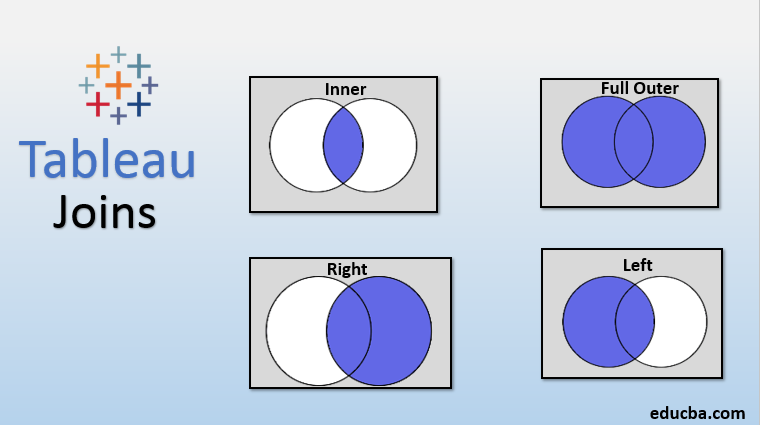
A way to extract data from multiple tables in the database is by Tableau Joins. They enable us to get data from different tables provided that the tables have certain fields common. The common field shall be the primary key in one table that acts as a foreign key in another. Various types of Joins include Inner Join, Left Join, Right Join, and Full Outer Join. Tableau allows us to perform joins in a very easy manner. It offers a guided approach to join the two tables providing a couple of important options. Using the functionality we can get data from different tables for analysis.

Types of Joins in Tableau and their Application

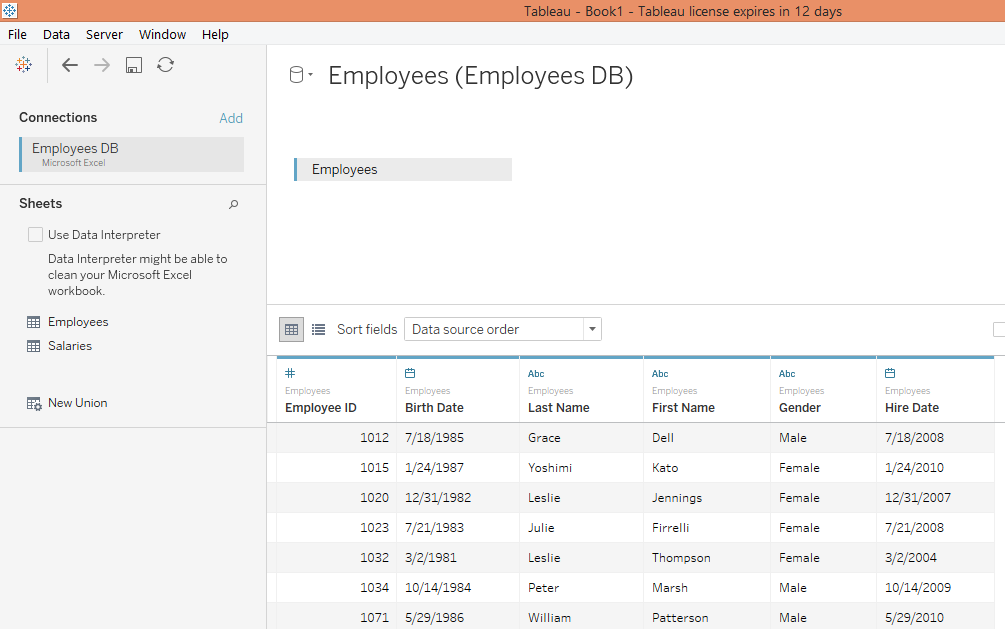
First, we will load the data source into Tableau. For this demonstration, we are using Employee data in Excel file. There are two tables present on two different sheets. The first table is Employees and the second table is Salaries. The Employees table contains dimensions Employee ID, Birth Date, First Name, Last Name, Gender, and Hire Date. The Salary table contains dimensions of Employee ID, Salary, and From Date. Employee ID is present in both the tables. Also, Hire Date and From Date is the same fields but with different names.

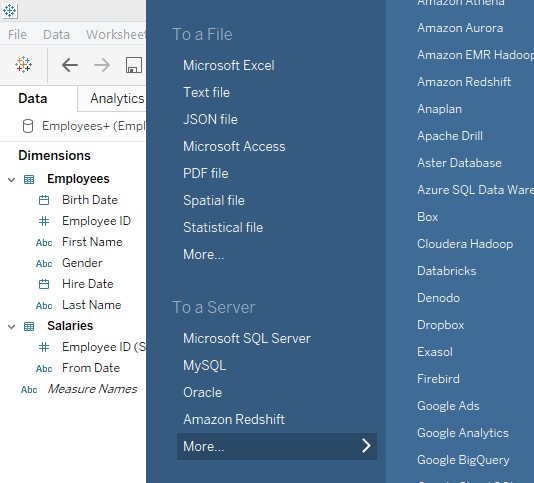
  • In the Data menu click on the “New Data Source” option. Then select the data source type.

select new data option

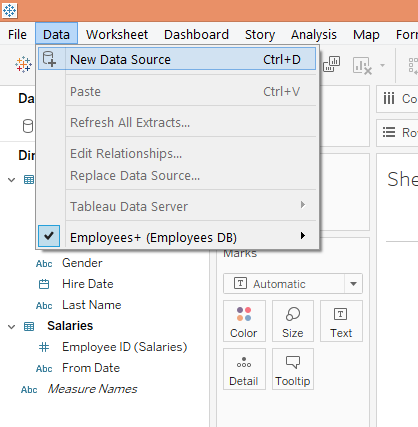
  • In our case, it is present as a Microsoft Excel file. Load the data source. The following screenshot illustrates this.

data in excel

Start Your Free Data Science Course

Hadoop, Data Science, Statistics & others

  • The data source gets loaded as below. Now, we will drag the tables “Employees” and “Salaries” one-by-one into the “Drag sheets here” section.

drag the table in tableau join

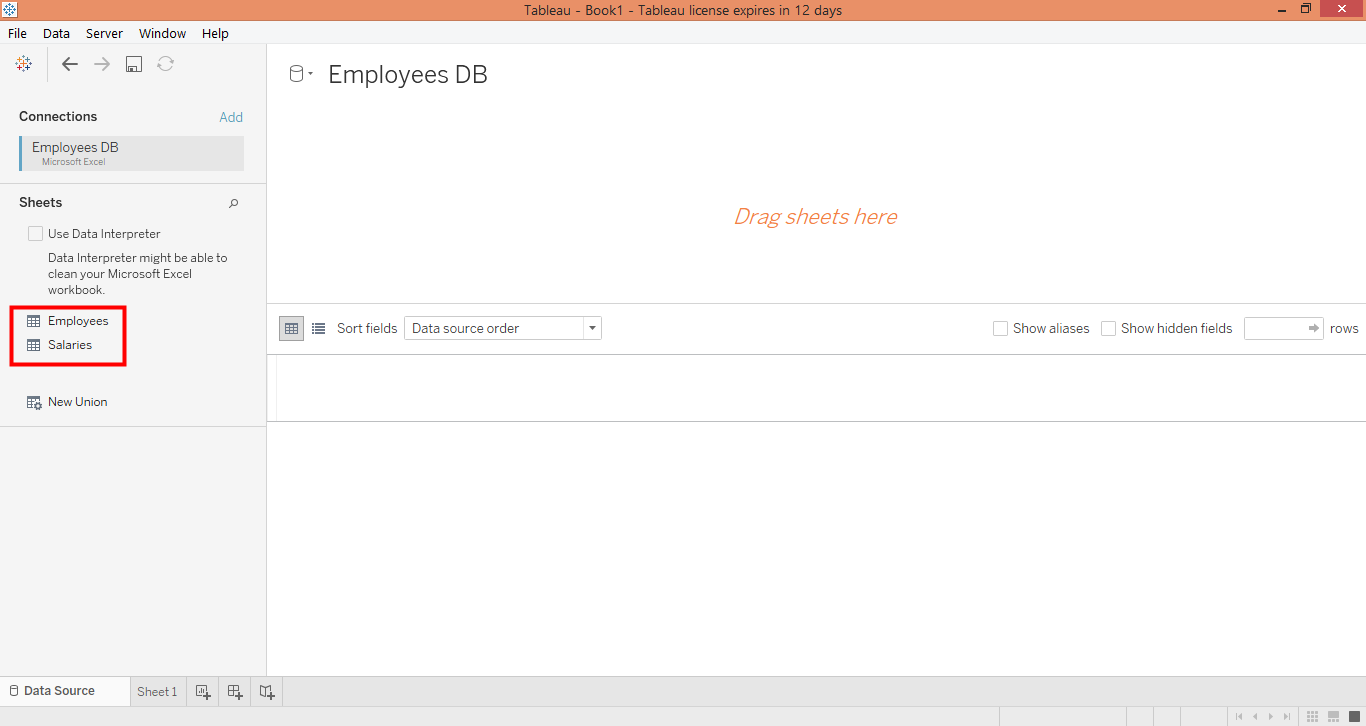
  • First, we dragged the Employees table as below.

drag employee table in tableau joins1

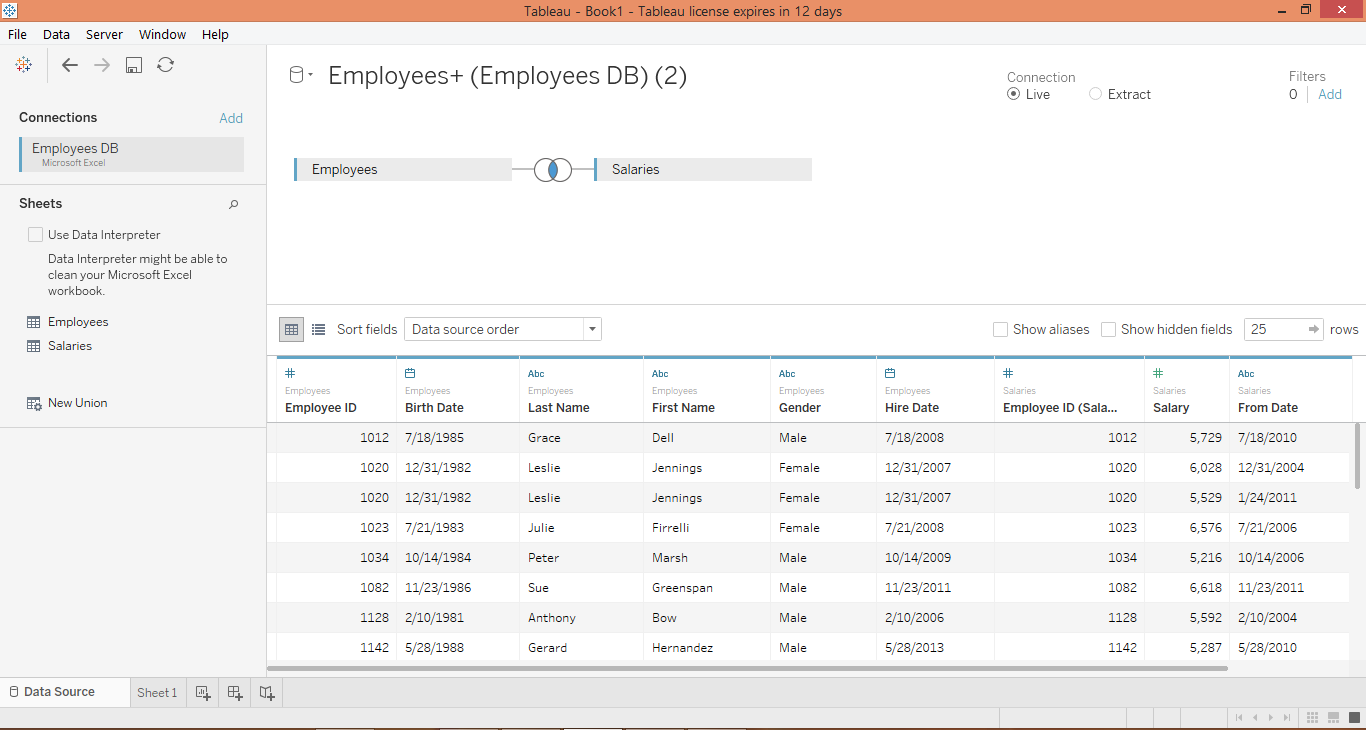
  • Now, see what happened when we dragged Salaries table also, an inner join got created automatically. The intersecting circles represent a join.

drag salary table in tableau joins2

1. Inner Join

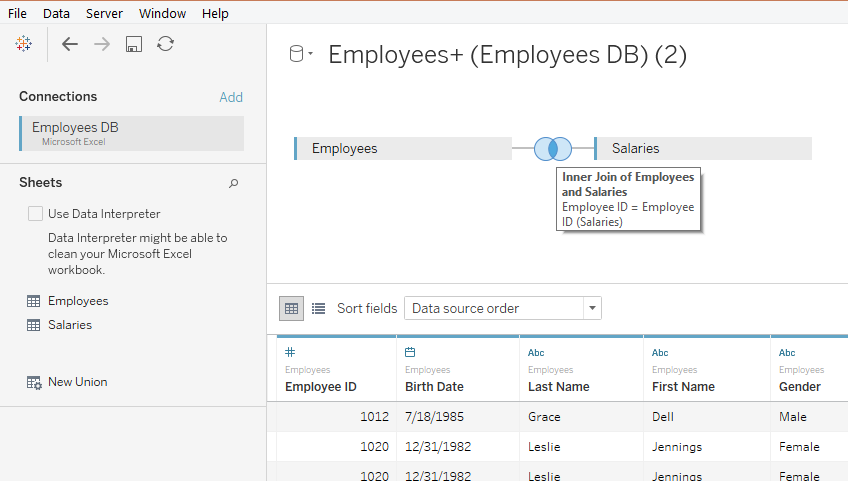
  • Hovering mouse over the intersecting circles gives details about the join as can be seen in the below screenshot.

intersecting circle in tableau joins

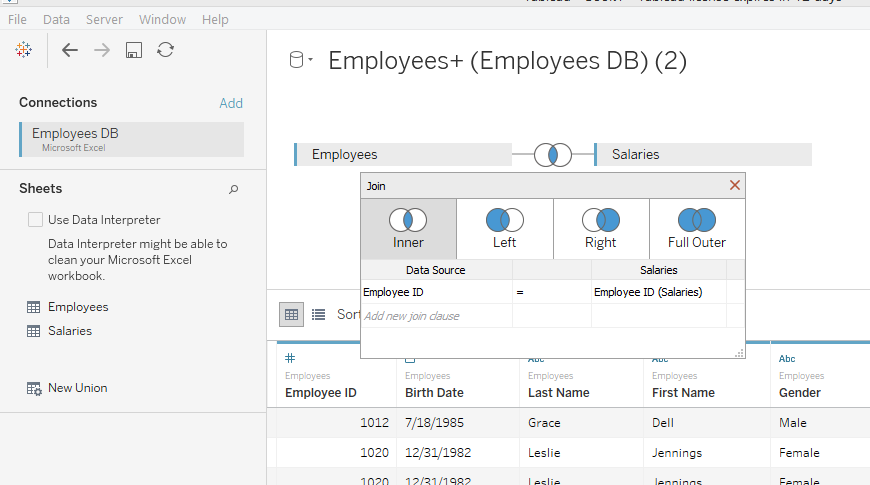
  • Click on the intersecting circles, and a box will pop-up. As can be seen, there are four types of joins viz. Inner, Left, Right and Full Outer. Currently, Inner join is selected which returns only common data between two tables. It’s like the intersection of two sets.

intersecting two side

2. Left Join

When the Left join is applied over two tables, complete data from the left table is considered, and only that data from the right table is considered which is common between the two. The following screenshot shows this.

left joins

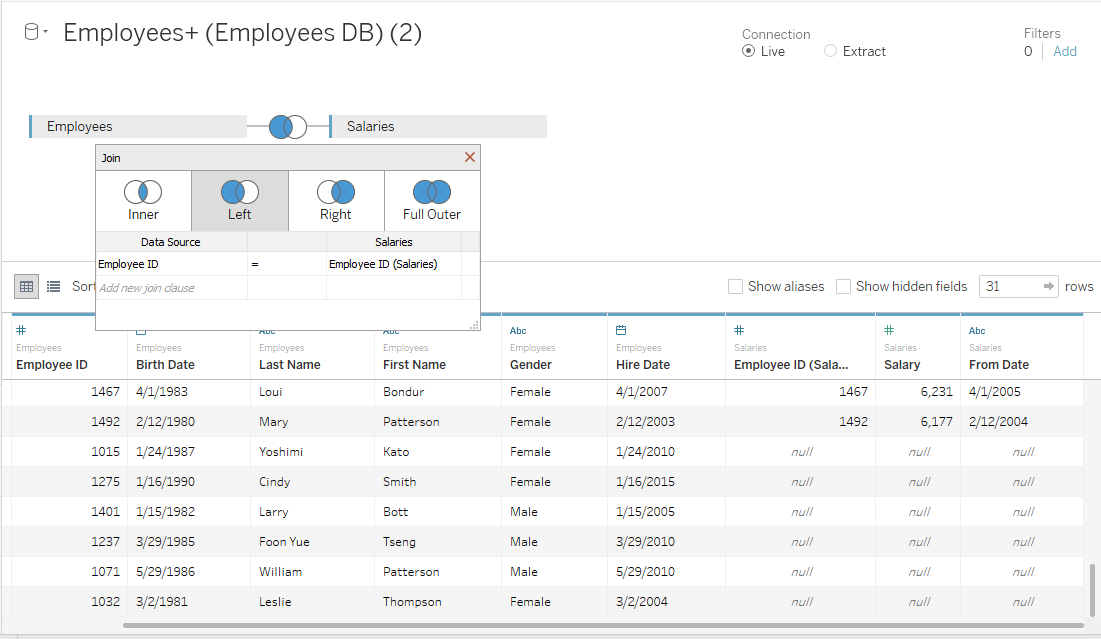
  • As can be seen in the above screenshot, in the right corner of the screenshot, there are “null” entries for dimensions from the Salaries table. This is because we have applied Left join and Employees table is the left table.

3. Right Join

When Right join is applied over two tables, complete data from the Right table is considered, and only that data from the left table is considered which is common between the two. The following screenshot illustrates this.

right join

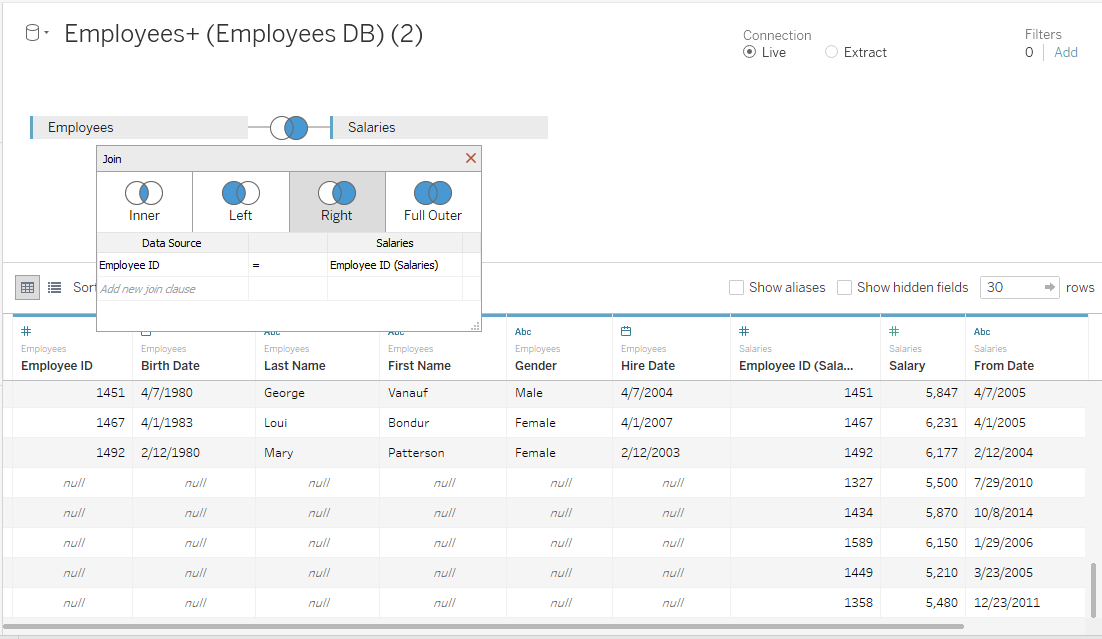
  • As can be seen in the above screenshot, in the left corner of the screenshot, there are “null” entries for dimensions from the Employees table. This is because we have applied Right join and Salaries is the right table.
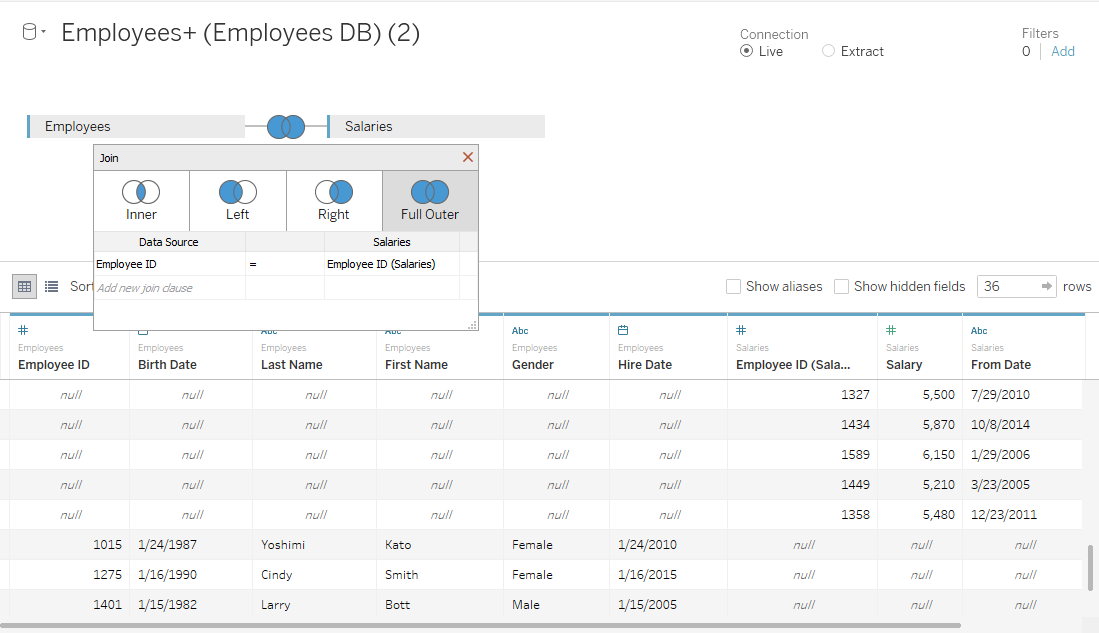
4. Full Outer Join

When applied, the join returns the data that is common to both the tables, along with the data from both the tables that is uncommon between the two. The following screenshot demonstrates this.

use full outer join

  • Using the drop-down menu as shown in the below table, we can select the common field for joining the two tables. Selecting the wrong fields will not join the tables giving the wrong result.

use full outer join

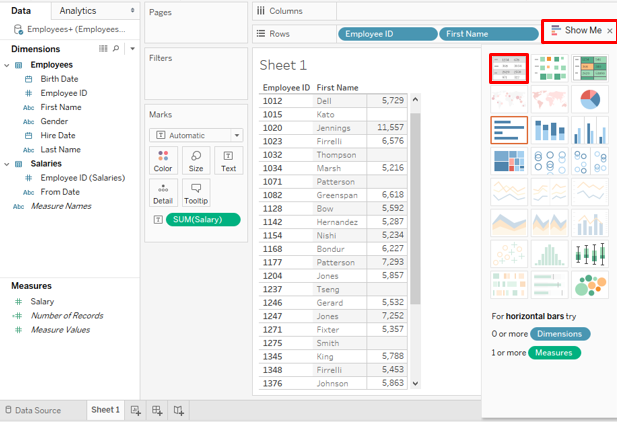
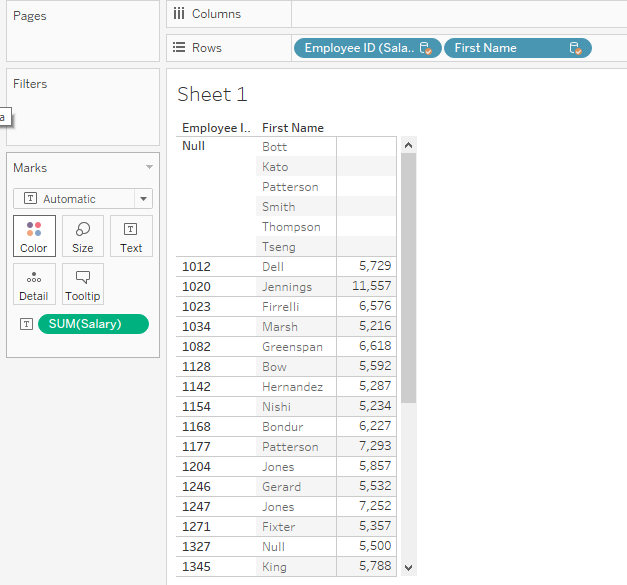
  • Now, we will check if the data returned by the join correctly works, when we try to analyze it on the sheet. In the Data section, we can see the two tables and their respective dimensions. Drag dimensions First Name and Employee ID into Rows region and Salary measure into Columns region. Click on the “text tables” option in “Show Me”, data gets presented in the following form. As we can see, for certain Employee IDs and First Names, no value has been returned for the Salary measure. This is because, when we select Employee ID from the Employees table, all Employee IDs in that table will be returned and also the corresponding First Names, but those entries are not present in the Salaries table, as a result, no value in Salary column is returned for those entries.

check the salary data

  • Now, we remove the Employee ID from the Employees table and drag Employee ID from Salaries table into Rows region. We get the result as in the below screenshot. As can be seen, this time all Employee IDs from Salaries table has been returned, along with corresponding First Names and Salaries. This time, for certain entries in the First Name column, Employee ID and Salary have returned no value. This is because those entries in the First Name are present in the Employees table but not in the Salaries table.

check employee data

  • In both the above cases, we got a result from both the tables. The common entries were returned along with details from both the table. However, we must keep in mind that the primary key must be selected from the appropriate table, as shown by the above examples. This is crucial when we have to generate insights on data extracted from multiple tables.
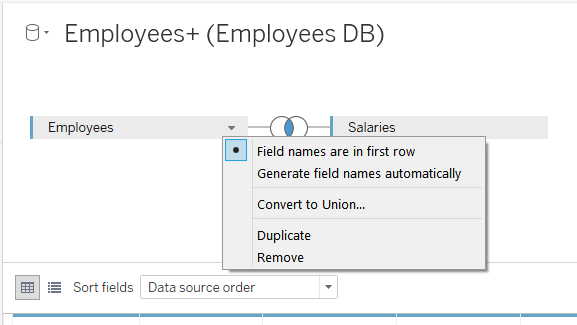
  • Now, we will explore in brief the options in the drop-down menu of the table below. Click on the drop-down menu of table Employee, and certain options will appear. The first option that is selected automatically is “Field names are in the first row”. This option displays the names of the fields as headings in the first row. “Generate field names automatically” generates field names automatically. “Convert to Union” option will create a union between the two tables. The “Duplicate” option creates a copy of the table as if we click on Duplicate for Employees, it will create a copy, Employees1. Clicking on the “Remove” option will remove that table from the pane.

final result in tableau joins

Conclusion

Join is a crucial concept in data warehousing that allows us to bring data from multiple tables together. They work like set operations in mathematics. Tableau offers an easy-to-implement approach, to implement joins between multiple tables, which facilitates detailed analysis as we can have the required data at our disposal.

Recommended Articles

This is a guide to Tableau Joins. Here we discussed the introduction and types of Joins in Tableau and their application. You can also go through our given articles to learn more-

  1. What is Tableau?
  2. How To Install Tableau
  3. Filters in Tableau
  4. Tableau Architecture
  5. Top 6 Types of Joins in MySQL with Examples
Popular Course in this category
Tableau Training (8 Courses, 8+ Projects)
  8 Online Courses |  8 Hands-on Projects |  55+ Hours |  Verifiable Certificate of Completion
4.5
Price

View Course

Related Courses

Business Intelligence Training (12 Courses, 6+ Projects)4.9
Data Visualization Training (15 Courses, 5+ Projects)4.8
0 Shares
Share
Tweet
Share
Primary Sidebar
Footer
About Us
  • Blog
  • Who is EDUCBA?
  • Sign Up
  • Live Classes
  • Corporate Training
  • Certificate from Top Institutions
  • Contact Us
  • Verifiable Certificate
  • Reviews
  • Terms and Conditions
  • Privacy Policy
  •  
Apps
  • iPhone & iPad
  • Android
Resources
  • Free Courses
  • Database Management
  • Machine Learning
  • All Tutorials
Certification Courses
  • All Courses
  • Data Science Course - All in One Bundle
  • Machine Learning Course
  • Hadoop Certification Training
  • Cloud Computing Training Course
  • R Programming Course
  • AWS Training Course
  • SAS Training Course

ISO 10004:2018 & ISO 9001:2015 Certified

© 2022 - EDUCBA. ALL RIGHTS RESERVED. THE CERTIFICATION NAMES ARE THE TRADEMARKS OF THEIR RESPECTIVE OWNERS.

EDUCBA
Free Data Science Course

SPSS, Data visualization with Python, Matplotlib Library, Seaborn Package

*Please provide your correct email id. Login details for this Free course will be emailed to you

By signing up, you agree to our Terms of Use and Privacy Policy.

EDUCBA Login

Forgot Password?

By signing up, you agree to our Terms of Use and Privacy Policy.

EDUCBA
Free Data Science Course

Hadoop, Data Science, Statistics & others

*Please provide your correct email id. Login details for this Free course will be emailed to you

By signing up, you agree to our Terms of Use and Privacy Policy.

EDUCBA

*Please provide your correct email id. Login details for this Free course will be emailed to you

By signing up, you agree to our Terms of Use and Privacy Policy.

Let’s Get Started

By signing up, you agree to our Terms of Use and Privacy Policy.

This website or its third-party tools use cookies, which are necessary to its functioning and required to achieve the purposes illustrated in the cookie policy. By closing this banner, scrolling this page, clicking a link or continuing to browse otherwise, you agree to our Privacy Policy

Loading . . .
Quiz
Question:

Answer:

Quiz Result
Total QuestionsCorrect AnswersWrong AnswersPercentage

Explore 1000+ varieties of Mock tests View more