Updated May 22, 2023
Definition of Tableau Gauge Chart
In a statistical setting, a single measure or data element is represented by a Tableau Gauge chart. Gauges are frequently found on executive dashboards and assist customers in immediately comprehending performances by using the orientation of the needle and the color of the dial.
What is tableau gauge chart?
In Tableau, gauge charts are similar to doughnut charts, which are similar to overlapped pie charts. White circles constitute the center area in this case, and we’re also attaching a needle to the interior and outside pies. A gauge chart works best in combination with the other gauge charts. The end consumers will be able to comprehend the perspective of present performance about objectives. Knowing Calculated Fields, LODs, and Donut Charts from Tableau is necessary for this. Learning Calculated Fields, LODs, and Donut Charts from Tableau is necessary for this.
How to create a tableau gauge chart?
A gauge chart has a pleasing appearance. Organizations can analyze many indicators visually by using a gauge chart in Tableau Desktop. The speedometer aids in comprehending the development or worth of a commercial metric. A dashboard with numerous gauge charts aids in the creation of a combined assessment.
Steps when creating a Gauge:
The Donut chart with Calculated Fields creation
On a desktop computer, launch Tableau and import the example dataset into the user interface. Start the Tableau worksheet and build the relationship between the entities once the data has been imported.
- Increase the columns and rows shelf dimensions as required.
- Create a dummy calculated field and put it on the column shelf with the value MIN(0).
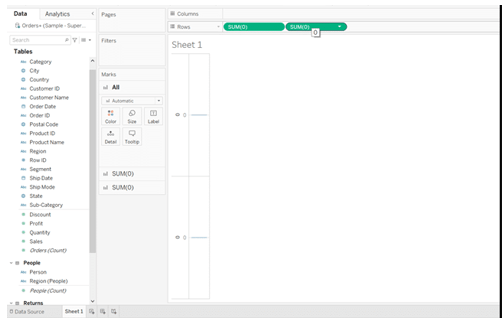
3. To replicate the calculation and turn it into a dual-axis chart, press the Ctrl key when clicking and drag the pill next to the original.
4. Even though it isn’t required, I always synchronize my dual axes out of habit.
5. Remove any rogue lines by editing the line layout and hiding the headers.
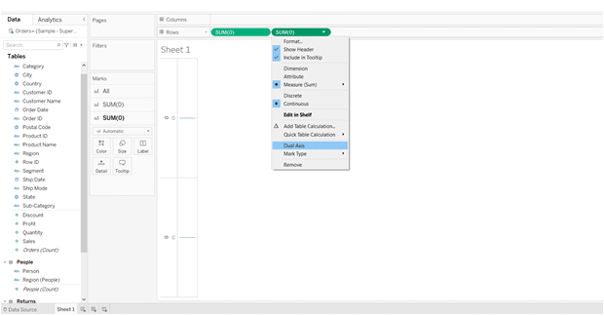
6. Change the right MIN(0markings )’s the sort to a circle and the left MIN(0marks )’s the type to a pie chart.
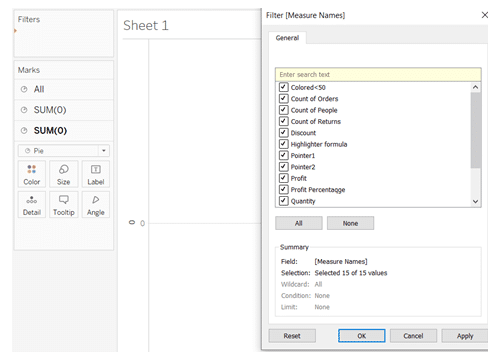
7. Change the circle’s color to fit the dashboard’s background, and do the size adjustment to match the background color. Additionally, make it smaller to create a donut chart. Once finished, stretch the donut across the interface by switching the style of the sheet to Entire View. Only the 10 Cal Fields that we defined above should be selected in the Edit Filter for Measure Names. Additionally, one can adjust the colors of the slices.
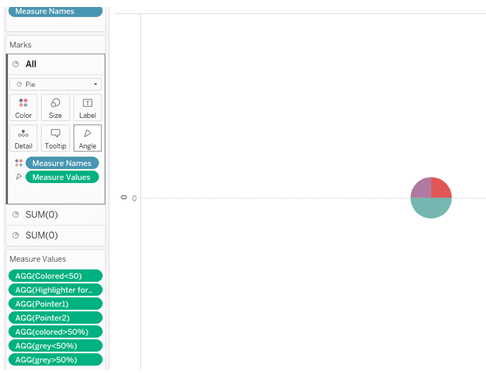
Using the measurements and computed fields we made in the previous part, follow the instructions below to generate a gauge chart: Drop Measure Names in the filters area and only choose the newly formed measures. Adding first and Second Quadrant Pointers respectively.
The computations for the small multiple are shown below.
Divider for the columns: (Index ()-1%) percent (Round (Sqrt (Size ()))
Integer ((Index ()-1)/(Round (Sqrt (Size ()))) as a row separator.
When to use tableau gauge chart?
In project management, gauge charts are frequently used to specify deadlines, modules, and associated information. A gauge provides a quick indicator of the productivity within a particular region and is simple to read and interpret. Tableau Dashboards with several Gauge Charts displaying the values of various metrics can be made. With different colored dynamic gauge charts of various sorts, many measures can be displayed in a centralized platform. Any organization that wants to undergo an in-depth study of the various metrics could benefit from this level of information. Just use Tableau Gauge Chart to produce and modify informative analytical dashboards. Gauge Charts can be conveniently created using Tableau Desktop. With much more knowledge, we can understand many Tableau issues and the answers that go with them. With a clear understanding of their suc
cess, a gauge chart that enables the business to thrive.
Examples
Starting with a sample data file with 10 clients and each of their percentages, let’s get started.
| 1 | Customer1 | 120 |
| 2 | Customer2 | 130 |
| 3 | Customer3 | 140 |
| 4 | Customer4 | 150 |
| 5 | Customer5 | 160 |
| 6 | Customer6 | 190 |
Step-1:
Connect to data and create calculation fields (Measures, colours). We require five additional fields.
| Slice1:
IF [ Percentage] < .5 then [ Percentage] ELSEIF ISNULL([ Percentage]) Then 0 ELSE .5 END Slice2: IF [ Percentage] < .5 then .5 – [ Percentage] ELSEIF ISNULL([ Percentage]) then .5 END Slice3: IF [ Percentage] > .5 then IF [ Percentage] < 1 then [ Percentage] – .5 ELSE .5 END END Slice4: IF [ Percentage] > .5 then IF [ Percentage] < 1 then1 – [ Percentage] ELSE 0 END else .5 END Slice5: MIN(0) |
We have numerous IF statements, as we will see in each scenario. This is necessary as we have to keep in mind the metric, we are using and whether or not the pointer must be visible.
Step-2:
Changing a Colour to differentiate measures in a Gauge. By assigning Slide 3 to white and others to grey and blue. An important metric must be established as well. We’re going to compare this value to the target. If necessary, labels can also be added. We must once more determine the degrees and radius of these spots before we can add labels.
Step-3:
Drag Percentage to the second axis’s label cards to finish. Adjust the label’s position to the centre or middle, then tinker with the text’s size until we are ready. The gauge’s build will be finished at this point. All we have to do is add it somewhere on the dashboard.
Such levels of indicators can provide management with more accurate information about profitable growth or the amount of the chosen threshold that has yet to be reached. Gauges are useful for displaying a solo KPI because they are simple to comprehend.
Conclusion
So that’s everything there is to know about creating Tableau gauge charts. There are many cases in which a gauge chart would have been the ideal choice to represent particular datasets. One may, for instance, show the research team’s work in progress and its level of accomplishment. Tableau’s gauge charts could also be linked to relevant data sources to generate in-the-moment insight.
Recommended Articles
This is a guide to Tableau Gauge Chart. Here we discussed the Definition, What is a tableau gauge chart, How to create a tableau gauge chart, and examples with code implementation. You can also go through our other suggested articles to learn more –
