Updated May 22, 2023
Introduction to Tableau Viewer
Tableau Viewer enables everybody in the organization to create data-driven decisions based on the available information. And it helps them associate their perception with reality and make data-driven decisions using dashboards created by Creators and Explorers. Unfortunately, the Tableau Version of windows is not accessible to users. Tableau Server seems to be the only ecosystem that viewers can access. In addition, the Programmer’s dashboards are not modifiable by viewers.
Overview of Tableau Viewer
Tableau Viewer is for individuals who might need analytical knowledge to do business jobs but choose to use data others have already developed. For example, business users who require data to do many of their everyday duties, managers and supervisors who know how their employees perform on major projects, and corporate leaders and executives who want elevated indicators of the company’s success are all instances of viewers. Tableau Viewer allows anyone to input data into discussions and respond to questions to make informed decisions based on factual information. Tableau Viewer users can access Tableau Mobile and view and communicate with files in Tableau Server.
The viewer is a wholly integrated BI solution that includes a large number of data connectors to data sources and business software, enhanced data management techniques, automation features such as data reloads, alerts, and activities, a drag-and-drop dashboard developer, and several options for safely sharing data visualizations with internal and external users.
How to Use Tableau Viewer (Empower, Secure, and Filter Data)
The two main components of data visualization are:
1. Tables, maps, graphics, scorecards, and other visualization choices are available.
2. Drill-drown zooms, filters, the ability to input values, and other interactive features make it simple for the user to analyze their data and find trends to make informed decisions.
a. Viewer’s primary roles encompass
- Look out for the dashboards that are accessible and put them on trial.
- Offer Developers with requests and input for the creation or improvement of dashboards.
- Engage in User Acceptance Testing (UAT) procedures for the new dashboards before launch.
- Report the matter to the creator.
b. Empower
- Empower the entire team to cooperate and create data-driven choices by providing them with trusted material.
- Tableau Viewer empowers more people to place information at the heart of every conversation with published dashboards, visualizations, and integrated content.
c. Filter data
- Filtering is an essential component of data analysis. Filtering is the process of removing specific values or a range of attributes from a collection of results.
- The scene filtering feature allows for basic and advanced circumstances using field esteem issues and counting or parameter-based streams. It also aids in illustrating how active filters can be displayed inside the view and how to style filters in the view.
- Understanding the sequence in which tableau performs filters in the workbook is critical.
- The order of operations refers to the order in which the tableau performs similar tasks on display.
The following is the order in which filters are applied:
- Filters to be extracted
- Filters for data sources
- Filters for context
- Dimensional filters (whether on the Filters shelf or in filter cards in the view)
- Measurement filters (whether on the Filters shelf or in filter cards in the view)
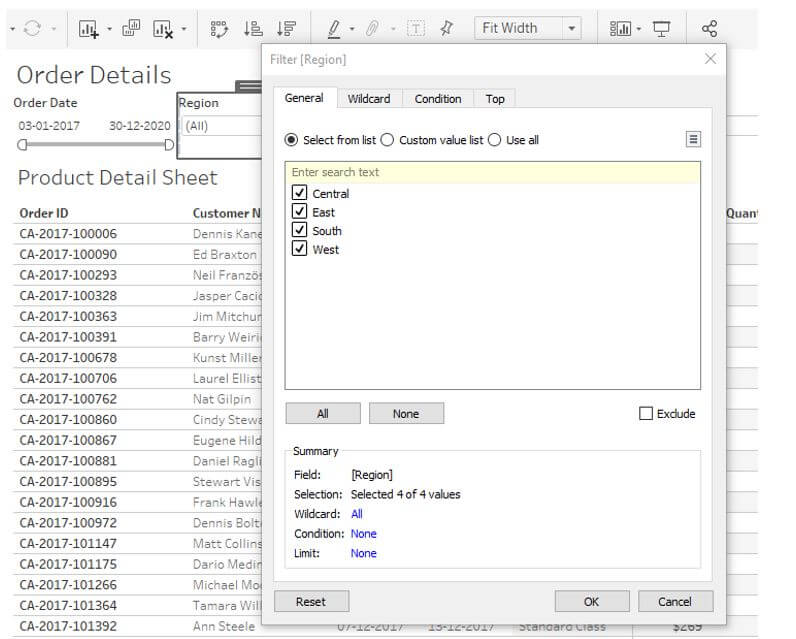
The following filter dialogue box occurs whenever we drag a dimension from the data pane to the filter shelf in Tableau Desktop.
General: Choose the data you want to include or exclude from the General tab.
Use the Wildcard tab to create a pattern to filter on (Tableau Desktop only). For instance, when filtering email addresses, one might only want to include emails from a particular domain. For example, including only Google email addresses creates a wildcard filter ending with “@gmail.com.”
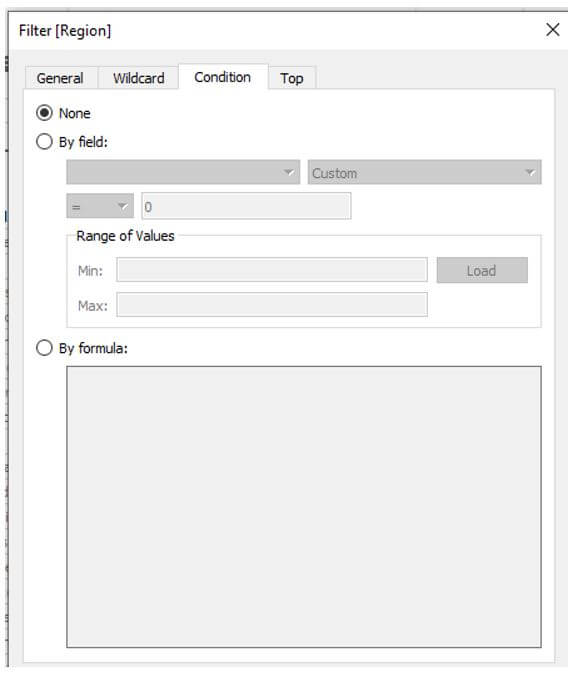
Use the Condition tab in the Filter dialogue box to define criteria to filter by.
d. Secure data
- Whenever we deploy a workbook or data source with user filters, we have to ensure that people who open the workbook or link to the Tableau Server data source don’t extract the filter, giving them access to all the data.
Tableau Business Intelligence
Let’s look at the Tableau BI platform and see why it’s regarded as one of the top data analysis platforms.
Tableau is primarily concerned with data visualization. Therefore, it is suitable for data analysts and business users regarding the user group. Furthermore, tableau needs virtually few coding skills for data searching and data visualization.
Tableau is a BI software approach that enables enterprises, organizations, and decision-makers to turn primary data into useful information, resulting in more productive and smarter process management decisions. In addition, this business intelligence tool enables users to quickly get the proper solutions to questions and inquiries about their information in real-time, resulting in wiser and more efficient heads of departments and decision-makers.
Tableau’s Business Intelligence and Data Analysis Solution have Several Advantages.
Aside from helping decision-makers examine data to allow them to lead a company on a lucrative path, tableau’s business intelligence software solution provides a lot of advantages to all customers. Creating dashboards is very simple using Power BI’s tiles, or visible indicators, which link to projects and datasets. People can instantly attach tiles from such a specific report to the dashboard.
1. UI is simple and easy to use: Tableau is a powerful system, yet the program is highly user-friendly despite its immense strength.
2. Other data sources can be connected: Tableau Business Intelligence and Data Analysis is a productivity suite that enables fast and accurate connection with diverse data sources.
3. Excellent customer service and assistance: Tableau BI software suite provides good customer service by giving customers full access to a dependable technical support team.
Conclusion
Therefore, tableau helps to bring insights to every area of the firm, from the solitary analyst to everyone across a large enterprise. In addition, tableau allows us to deploy the finest analytics at a lower cost and with greater flexibility. And also created many of the content, data visualizations, and information sources other Tableau users utilize.
Recommended Articles
This is a guide to Tableau Viewer. Here we discuss the introduction, how to use tableau viewer, tableau business intelligence, and its advantages. You may also have a look at the following articles to learn more –
