Updated May 10, 2023
What is Tableau?
Tableau is a data visualization software with interactive dashboards which tells us about the storage of data. We can slice and dice our data in any way we like. Analysis can be done either through script or point-and-click. Tableau’s free version uses a Visual Query language called VizQL for exploring the extensive database. It has two versions: personal and professional, as the personal edition connects to 7 data sources, including Excel and CSV files. It imports the data source from another workbook. With the professional edition, hundreds of data sources are connected. It is compatible with Tableau Server and Online.
It is compatible with database types (spreadsheet, Bigdata, access data warehouses, cloud applications, and cloud databases). Cross-database joins extremely powerful in the Tableau free version.
Tableau’s actual process is to perform an analysis of data by visualization. Humans have used visualization to describe the data in different insights. Easy to use drag and drop interface. Data scientist is using data analysts in many other industries. It allows business users to create their reports effortlessly by reducing backlog reports.
Is Tableau Free?
It is an emerging BI tool in a growing market as users demand good data visualizations and dynamic access services. Yes, Tableau free version is the trial version which uses the Tableau desktop. Tableau free version is not cost-effective for a small organization when creating data visualizations. Consumers can get the public version of the Tableau desktop for a free license. It offers free versions of its proprietary solutions and satisfies business analysts. Tableau Public is the name of the free version of the desktop solution. They use web connectors to connect databases that publish in HTML forms. It doesn’t need complex data sources.
Pros
- Speed: It analyses millions of rows with efficient speed to give the response in seconds; that is why the growing market puts Tableau in its ranking.
- Ease of use: customers don’t require any programming skills.
- Dashboard interactive: They give out dynamic results with rich graphics and charts.
- Easy sharing: The results are shared live on the web.
Cons
- It is not designed for broad business; the Tableau free version is modeled for small organizations.
- Like SAAS, it doesn’t support statistical analysis.
- It doesn’t integrate social platforms. It supports only the Microsoft Platform.
Why Visual Analytics?
Visual Analytics Reduces the time to insight.
They improve decision-making to see accessible summary reports and outliers.
Why do we care about Tableau?
- The increase in the importance of Business Intelligence.
- leads to better understanding, decision making
- Developers implement interactive data visualizations in web applications.
There are five significant tools here
- Tableau Desktop
- Online
- Server
- Reader
- Public
Desktop and Online are used to create different types of reports. The last three tools publish their reports without paying. The reports are saved as the workbook.
- Tableau Reader: This is a free version that consumes Tableau desktop reports.
- Tableau Server: saves time when we have many people devouring the work. It is licensed in two ways: named user and core licensing. It creates a subscription that provides notifications when reports are published.
- Tableau Public: It is limited to storage Space. Anyone can view workbooks. This has a premium version with subscriptions which is a fee-based service.
Tableau Online vs Tableau Server
Tableau Online doesn’t need a server setup. It had the pricing of Explorer license and Viewer Licence. All the online data residing in Tableau Server are not on their own.
Starting with Tableau
Tableau free version software currently runs on Windows Environment. The first thing to do is connect to data.
Connecting the database with TTableau
You can connect either through the local file or to the server. While in the process, data can have a Live Connection.
Here we use the database concept called joins with tables. We use joins when we make our initial data connection. Each table has a unique identifier that links the tables together. These identifiers are called keys.
Example:
We can start our connection process to the spreadsheet.
In the connection menu -> select multiple tables and click on Add table button -> Return Tab.
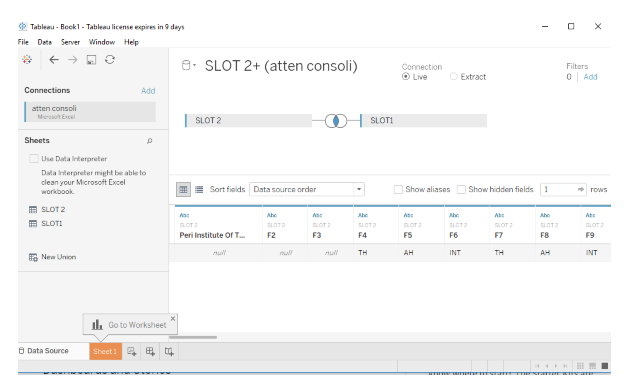
Tableau joins two tables: Joins are robust and persistent
- Click the join icon, which displays join details such as inner, outer right, and full outer.
- The inner join gives the result that matches both the left and right tables.
- To use a different field joining two fields: Click the attribute pull-down arrow as shown above in Fig:
Blending data sources in a Single Sheet
Blending can alter the primary data source for each work page.
There is two possible way of creating a blend:
Automatic method
- It works if both the data sources have the same field name.
Manually defining
- It uses edit relationship means to blend.
Tableau Filetypes
- It uses edit relationship means to blend.
Tableau Filetypes:
-
- Workbook(.twb)
- Data source(.tds)
- bookmark(.twb)
Building Visualization
Done by
- Crosstables
- Charts
- Maps
Here comes the creation of charts in visual analytics. It is the process of gaining data in an interactive interface. They separate the data into Dimensions and Measures. Dimensions give text columns. Measures give us numeric values. Aggregation is done to aggregate data.
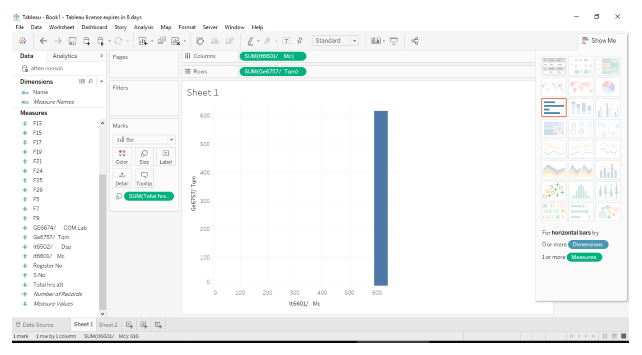
Table Calculations
- Formulas define calculated values, for example, SUM. They are used to generate numbers and dates.
- The elements required are:
- Functions, fields, Operators.
- The index function counts the position of a row or column in a set.
Using MAPS
They provide granular geographic details. We can create map Visualizations within a second. Geographic units include area code, city, and country. Tableau uses detailed online maps. Tableau’s free version provides two types of maps for displaying data.
- Symbol
- Filled
Conclusion – Is Tableau free
The quality of data visualizations and self-service analytics makes the tableau-free version unique compared to other BI tools. Tableau’s free version takes only a minute to connect and extract data sets. The design aims to be user-friendly and not require IT intervention. Every Functionality is possible using drag and drop. Tableau license is costly. If the license expires, the user cannot access the server.
Recommended Articles
This has been a guide to Is Tableau Free. Here we have discussed basic concepts about the Tableau free version, practical tools, and examples of Tableau. You may also look at the following articles –
