Updated March 24, 2023

Introduction to Legend in Tableau
A visualization does the important work of conveying insights from data. However, it won’t be possible for the user of the analysis to correctly interpret the insights unless there’s a clear representation of the various parts in the data. The meaningful representation of the data is enabled by legend, a crucial part of any visualization. Legend makes use of colors, shapes, texts to highlight the various parts of the visualization effectively. Tableau provides various options pertaining to the concept which makes Legend important.
Understanding Legends in Tableau
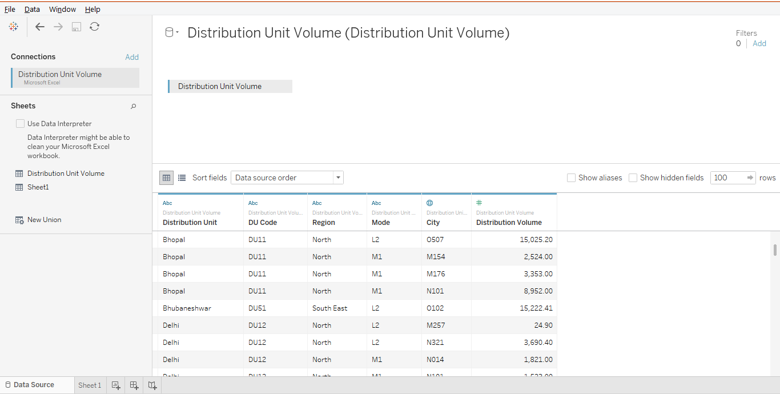
Let’s now go through the step-by-step procedure to understand various operations pertaining to legends in Tableau. For this demonstration, we are using the Distribution Volume dataset. It contains volume distributed to various cities across India. The important dimensions are Mode, Distribution Unit, and Region, while the Distribution Unit is the measure in the dataset.
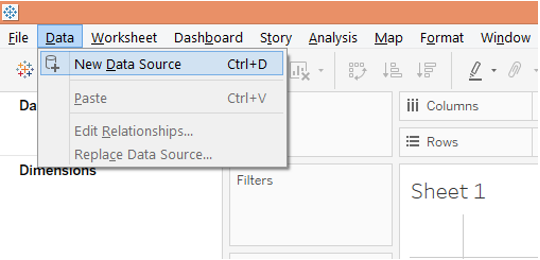
Step 1: First load the dataset. For that click on “New Data Source” under Data Menu as shown below.
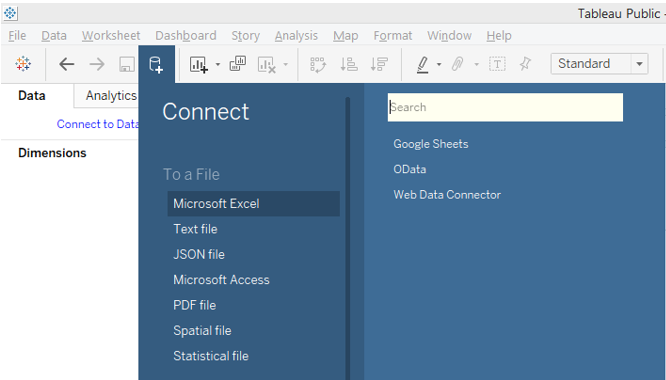
Step 2: In the Connect section select the requisite data source type. In this case, it is clicked on “MS Excel”, so click on “Microsoft Excel” as shown below.
Step 3: The data gets loaded and can be seen in the Data Source tab as shown below.
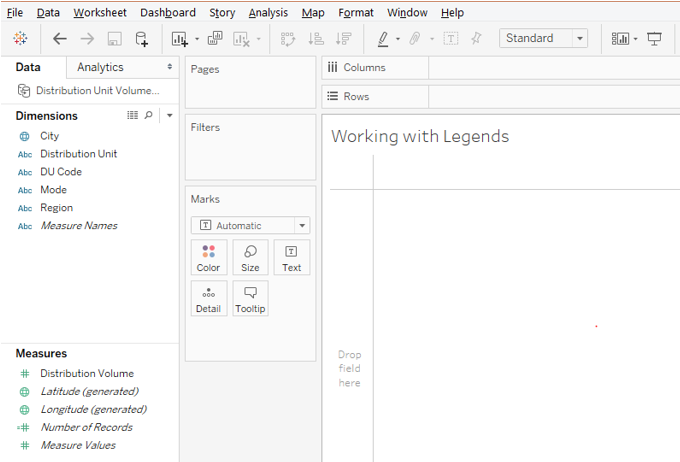
Step 4: Moving to the sheet, we can find the dimensions and the measure present in the requisite sections as shown by the below screenshot.
Creating Legend in Tableau
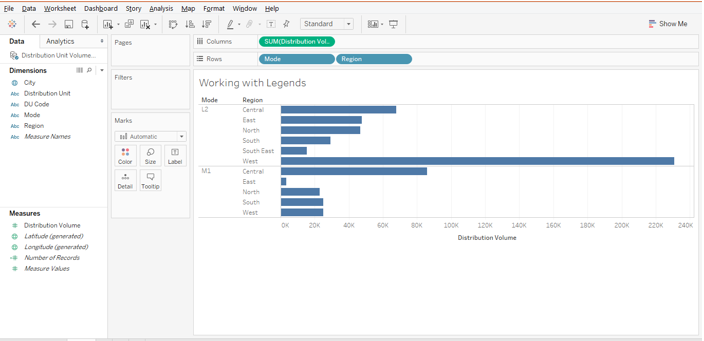
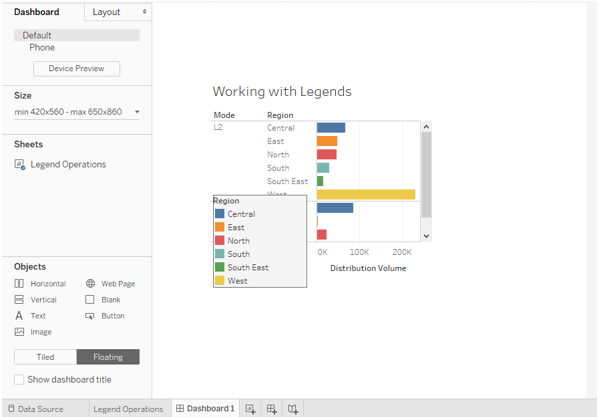
Step 1: First, let’s create a simple visualization. Bring dimensions Mode and Region into Rows region, and measure Distribution Volume into the Columns region. We get a horizontal bar chart as shown below. It essentially gives us the Region wise Distribution Volume by two different modes. However, the visualization doesn’t seem that insightful owing to a single color which makes interpretation difficult. So, we need to create a legend.
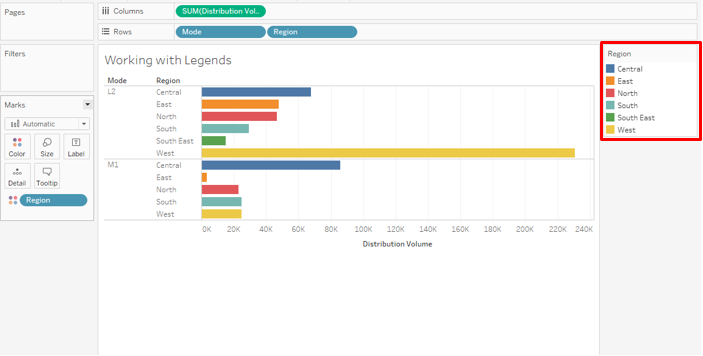
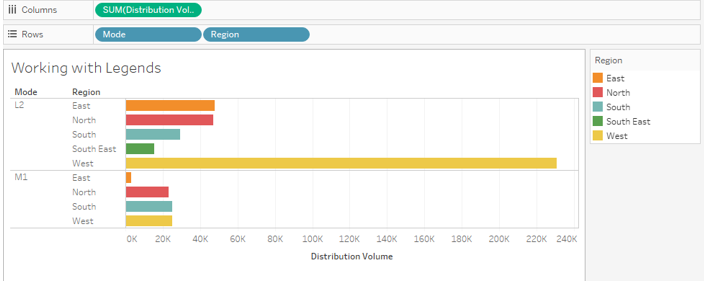
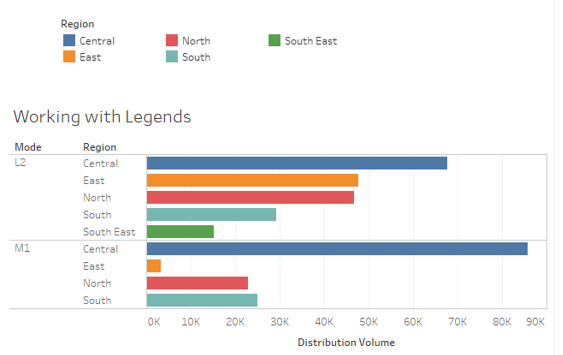
Step 2: As shown in the following screenshot, we just dragged Region dimension over Color in Marks card, and automatically, Region Legend got created. This is as highlighted below.
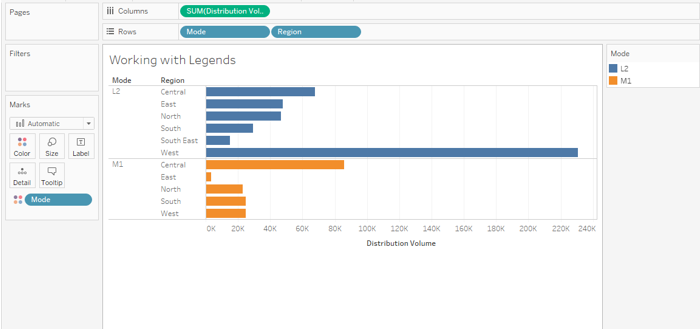
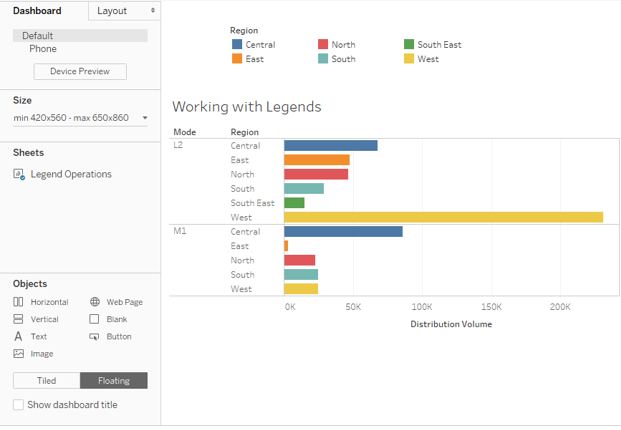
Step 3: Like Region legend, we can also create a legend for the Mode dimension. This is as shown by the below screenshot.
Deleting Legend in Tableau
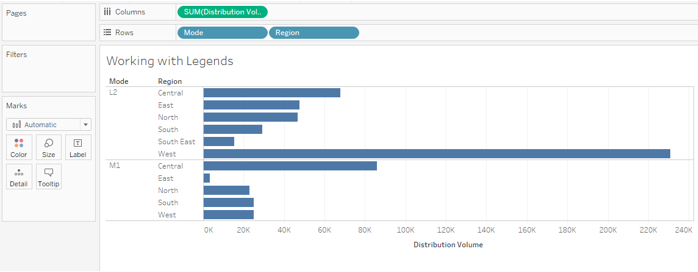
Step 1: In order to delete the legend in Tableau, Remove the dimension from Color in Marks card, and automatically the legend disappears. This has been shown in the below screenshot.
Step 2: We can also delete a particular legend entry. Like as illustrated by the following screenshot, we clicked on Central, and selecting “Exclude” will remove it from the analysis.
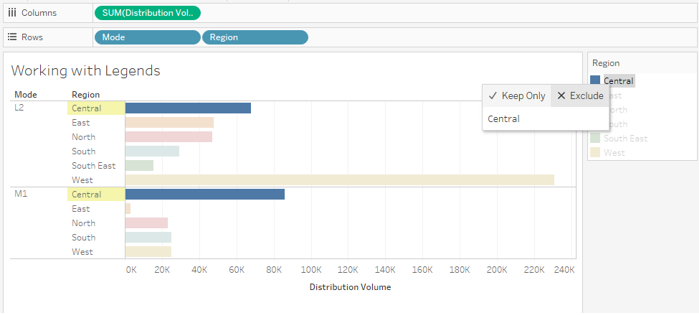
Step 3: As shown by the following screenshot, the Central region has got removed from the analysis.
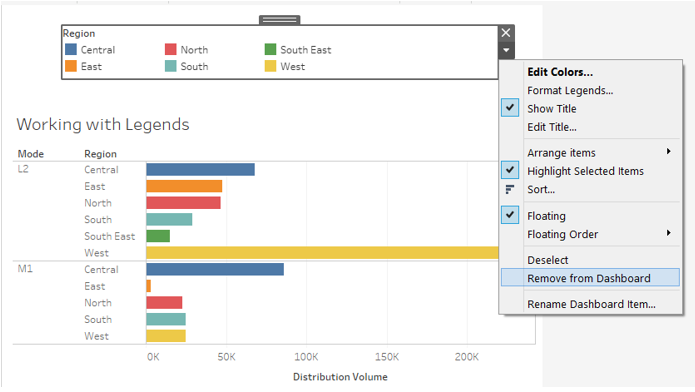
Step 4: We can remove the legend, by selecting the “Remove from Dashboard” option as shown below.
Floating Legend in Tableau
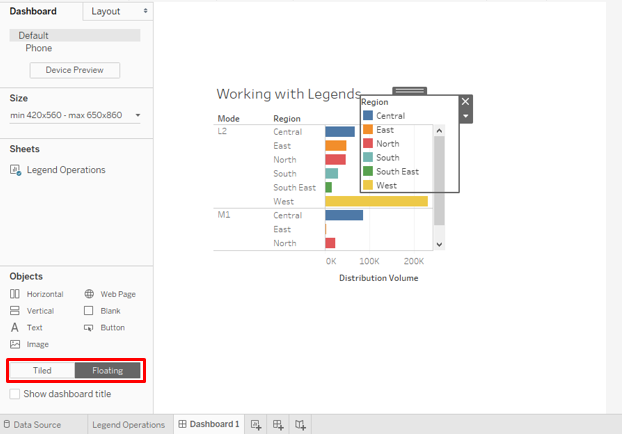
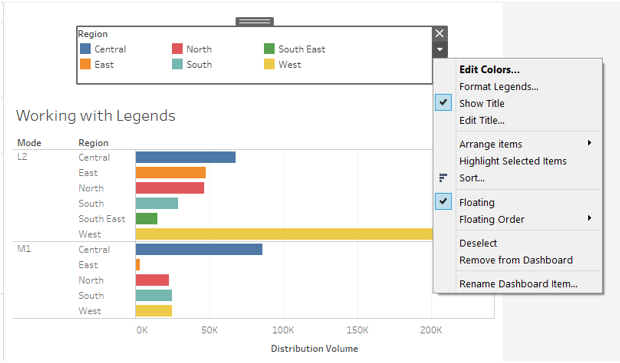
Step 1: Floating is a concept in Tableau that allows free movement of the visualization or legend in the dashboard window. The following screenshot shows how the legend of the visualization has overlapped on the visualization. To have floating functionality enabled, the Floating option must be selected as highlighted in the following screenshot.
Step 2: The following screenshot illustrates a floating legend. It is basically being moved freely by the mouse.
Step 3: Though we can float legends as we want, they must always be set over a dashboard in a systematic manner as shown below.
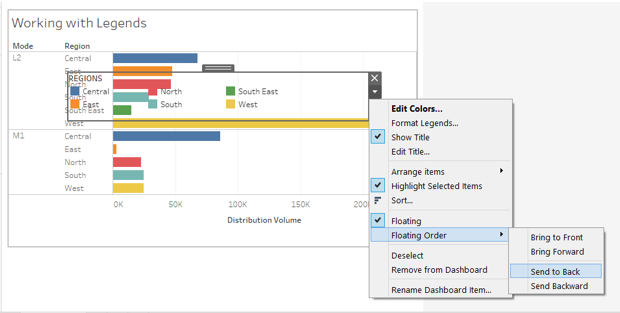
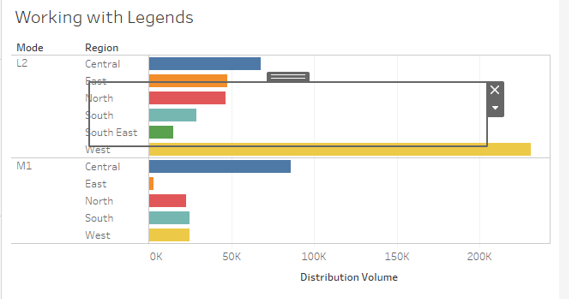
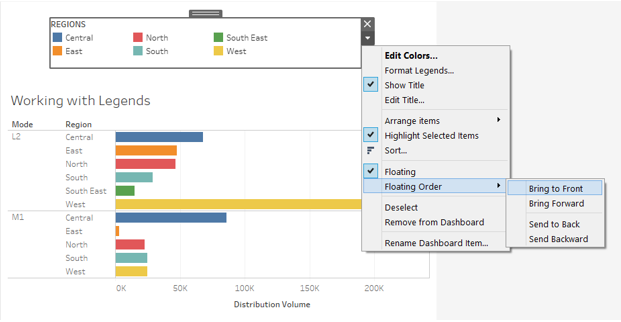
Step 4: In the drop-down menu of the legends, we have two options pertaining to Floating viz. Floating and Floating Order. The Floating is checked because we ensured it in the prior steps. In the Floating Order, there are four options that allow us to display legends accordingly. As shown below, selecting “Send to Back” disappeared the legend entries as shown by the screenshot subsequent to the below screenshot.
Step 5: We can bring back the entries by clicking on the “Bring to Front” option in the Floating Order, as shown below.
Editing Legend in Tableau
Tableau provided us with numerous editing options. We shall see them in the following section.
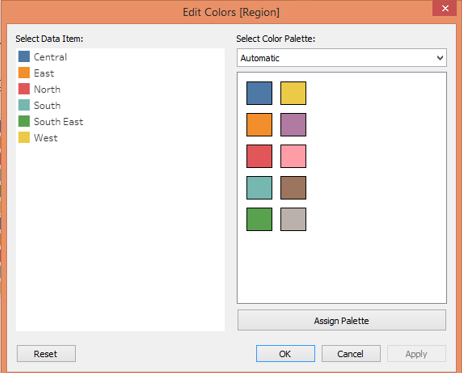
Step 1: Click on the drop-down menu of the legend. We can find multiple options using which the legend can be edited. The first option is Edit Colors, highlighted in bold. Just click on it and the Edit Colors dialogue box pops-up as shown by the screenshot subsequent to the below one. From here, we can select colors for legend entries as needed.
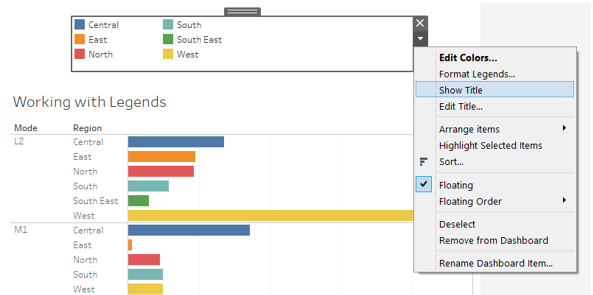
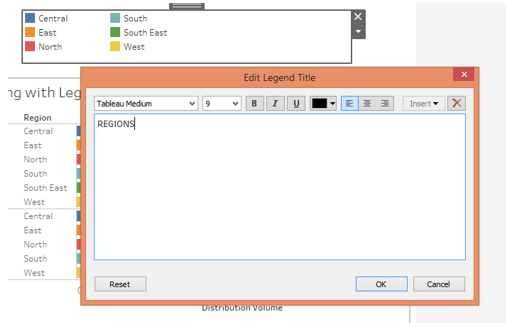
Step 2: The following screenshot shows how unselecting “Show Title” removed the title of the legend. Just select the option to bring the title back. We can edit the title. For this click on the Edit Title option and type the requisite title in the “Edit Legend Title” box as illustrated by the screenshot subsequent to the below one.
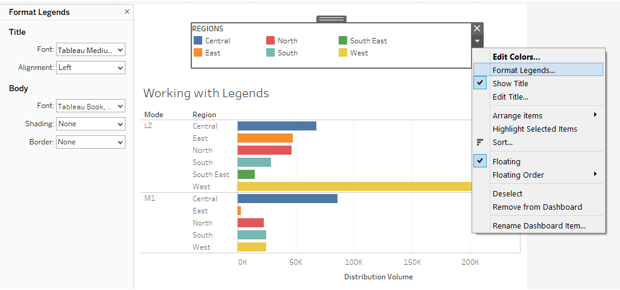
Step 3: We can format the legend by clicking on “Format Legends” option. On the left side make necessary changes in the Format Legends section. The following screenshot shows this.
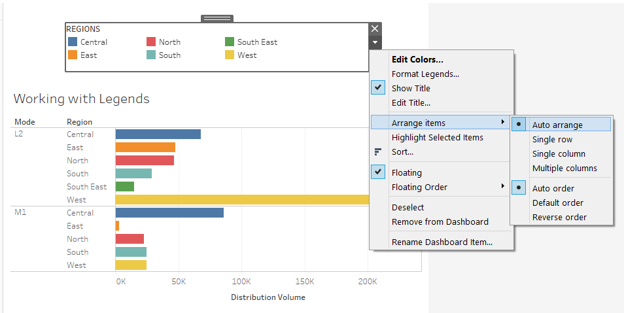
Step 4: The legend items can be arranged as needed. Various options under the “Arrange items” option facilitate this as shown below.
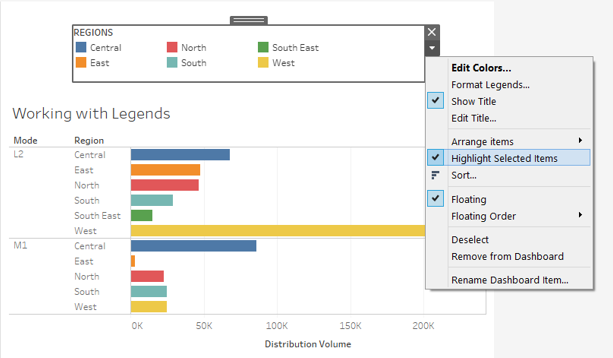
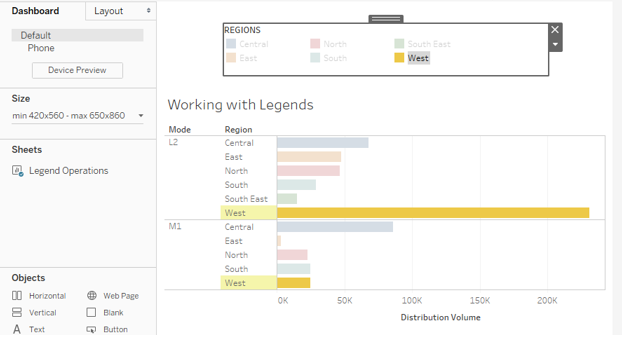
Step 5: The “Highlight Selected items” enable us to select particular entries. If this option is not checked then individual selection won’t work. The following screenshot shows the option is checked.
Step 6: The following screenshot shows, how selecting West legend highlighted the west region in the visualization.
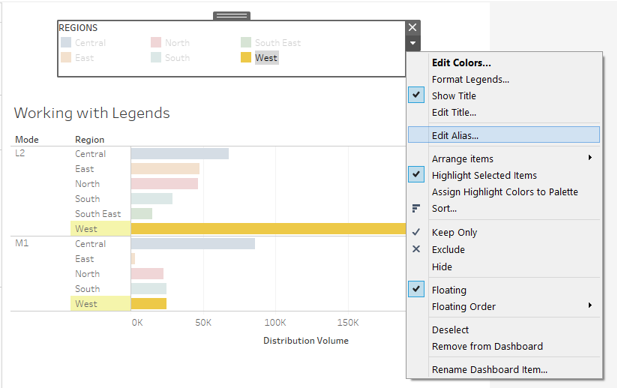
Step 7: We can change the name of any particular entry. Just click on it, and in the drop-down menu click on the “Edit Alias” option.
Hiding and Unhiding Legend in Tableau
Step 1: The legend that we create can be hidden and brought back. In order to hide a particular item, click on it, and in the drop-down menu, click on Hide. This is as shown by the below screenshot.
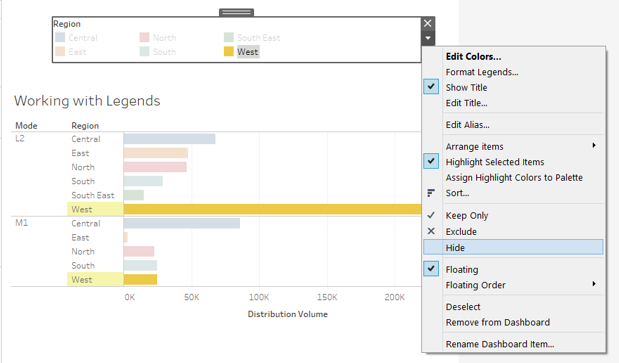
Step 2: In the following screenshot, we hid the legend for “West” following the above step.
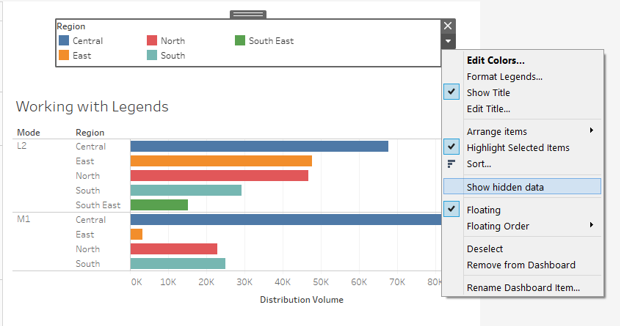
Step 3: We can unhide the legend by clicking on the “Show hidden data” option in the drop-down menu of the legend as shown below.
Displaying Colour
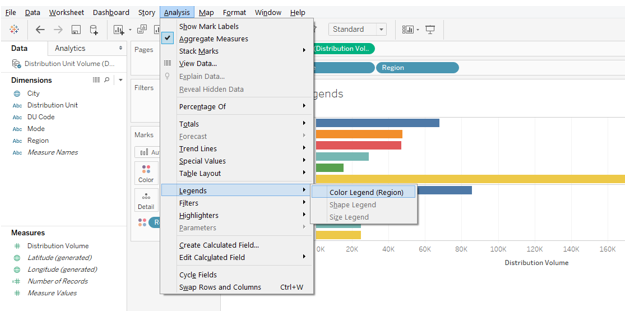
Step 1: In the Analysis menu, in Legends, click on Color Legend.
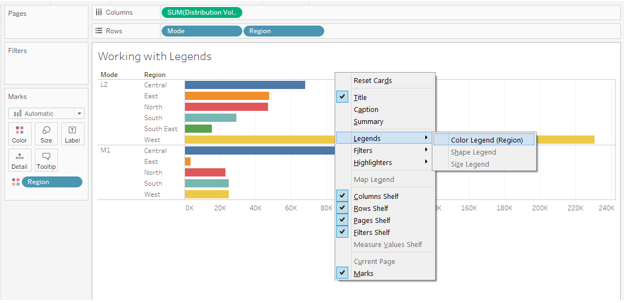
Step 2: Right-click on the visualization, and select Color Legend in Legends.
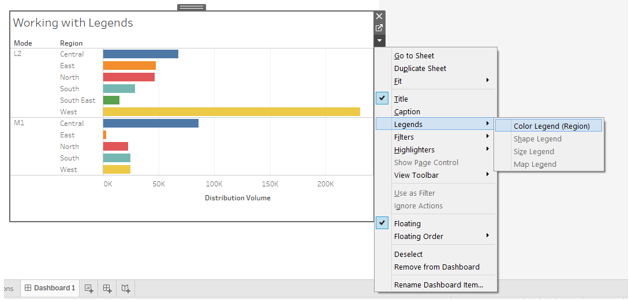
Step 3: In the case of the dashboard, in the drop-down menu, click on Color Legend in Legends.
Conclusion
Tableau provides elaborate functionalities to deal with legends. The legend in Tableau is not just an ordinary element associated with visualization. It is rather an important part of the analysis which can be manipulated as per the requirements of users.
Recommended Articles
This is a guide to Legend in Tableau. Here we discuss the step-by-step procedure to understand various operations pertaining to legends in Tableau. You may also look at the following articles to learn more –
