Updated March 21, 2023
Introduction to Tableau Drill Down
Tableau Drill Down is the feature to represent the hierarchical data view of the visualization. It helps in-depth analysis of a particular dimension and its dimensions with the details of measures. The drill-down reports are context-specific and are created for specific business requirements. Some of the examples of drill-down reports in Tableau is representing sales data for a country, region, state and city levels. Similarly, representing the year, month, the date representation is a common use case for drill-down reports. Tableau provision to view the drill-down feature on the dashboard. Drill down is an important feature in Tableau that adds value to business intelligence(BI).
How to use Tableau?
- We will start with the data source.
- Connect your dataset to the tableau.
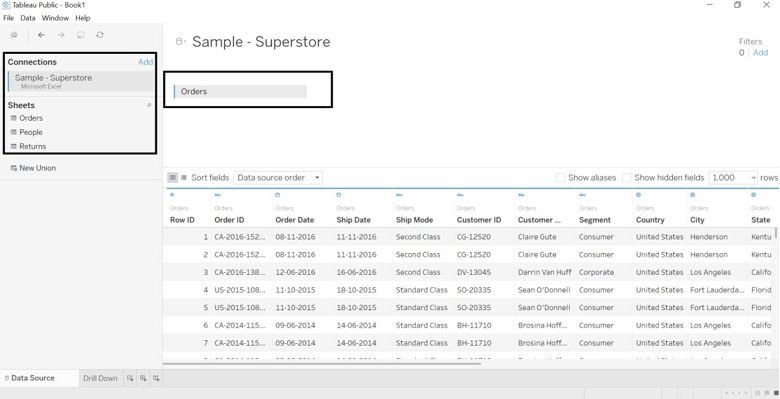
- Open Tableau Desktop or Public->Click on File->Open (a file which you want to work with, it could be either xlx, pdf, txt, etc.).
- We have opened the Sample-Superstore database, out of which the orders table has been dragged.
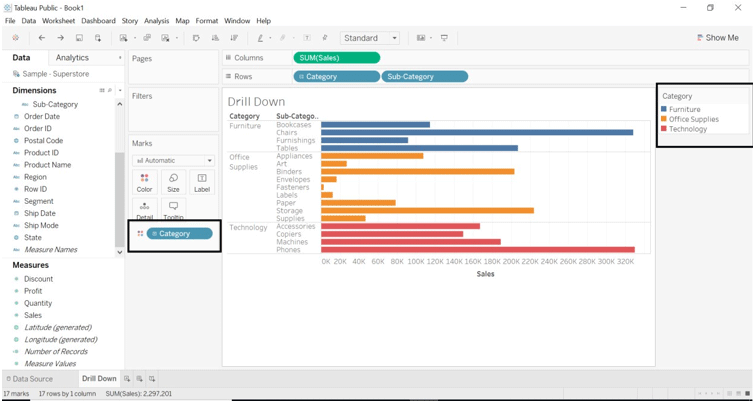
- Go to the worksheet, where you will see data divided into dimensions and measures. Name a worksheet as you want (we have named it as Drill-Down).
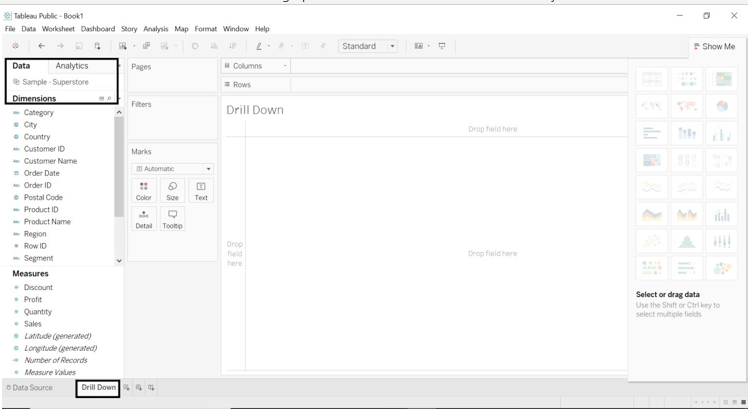
- Drag dimension and measure to rows and columns.
- Drag the Category and sub-category dimension into rows.
- Drag Sales into columns.
- We will get sales as per category and sub-category.
- For formatting, drag the category into the Color Marks card.
- Look at the Category section given on the right side of the sheet.
We will look into how each region performed.
- Drag Region dimension into Filters and columns.
- We can select either all-region or one or two.
- We have selected all the regions.
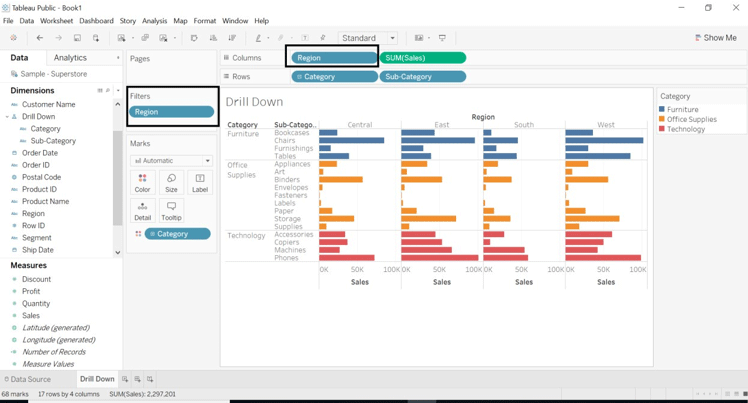
We will look more for formatting the worksheet.
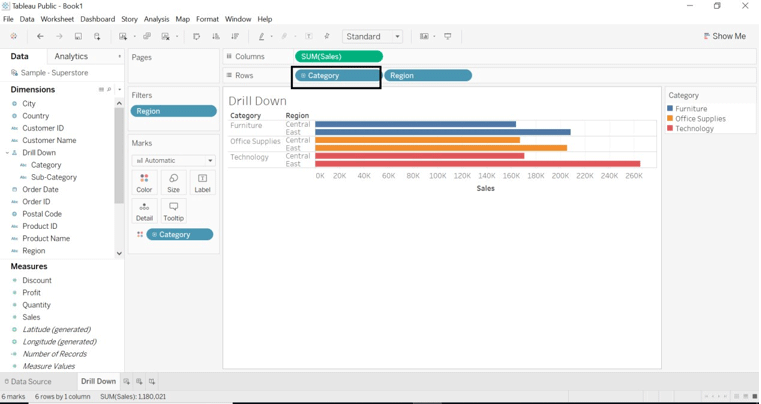
- Drag sub-category into category new window will popup name hierarchy. Give it a name you want. We have given the name Drill Down.
- Drag region dimension into rows and select 1 or 2 regions only.
- The Category dimension will get a drill down with a sub-category.
- Look at the + sign on the category icon.
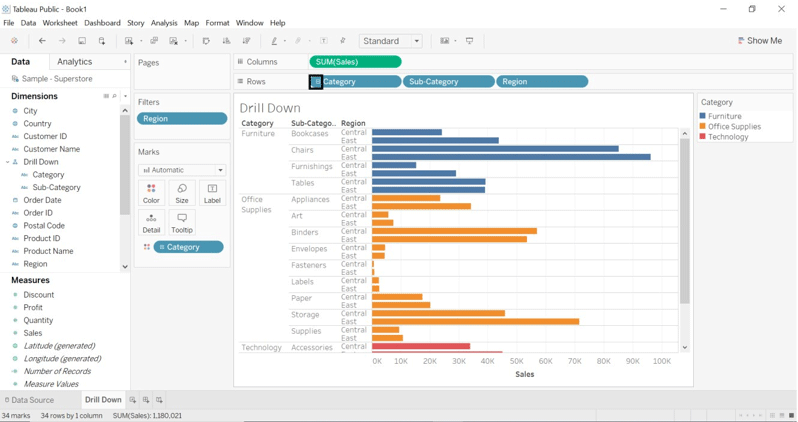
- If we want data with a sub-category, click on + sign on category dimension. + sign has changed to –
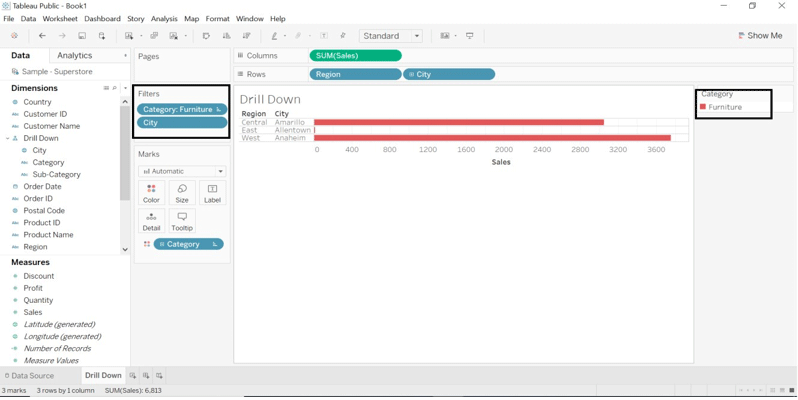
- Drag City dimension into Filters (Marks card).
- Select the city you want.
- Drag Category into Filters (Marks card) Select the category you want.
- We can change the color of any filters.
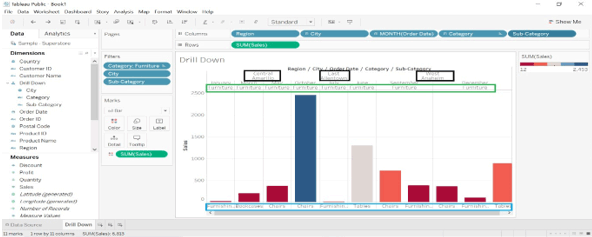
- Drag Order Date dimension into columns.
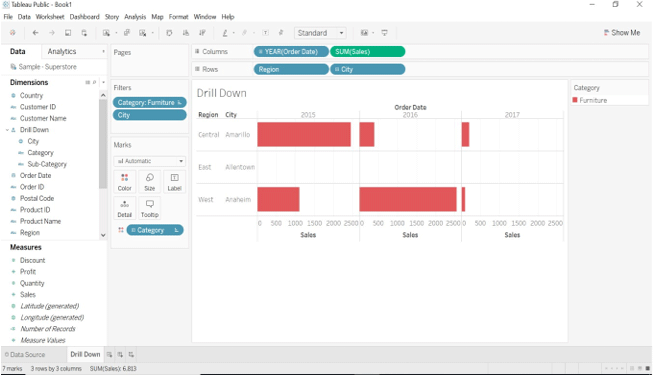
- Order Date dimension has a + sign; click on the drop-down menu we can select the year, day, quarter and month.
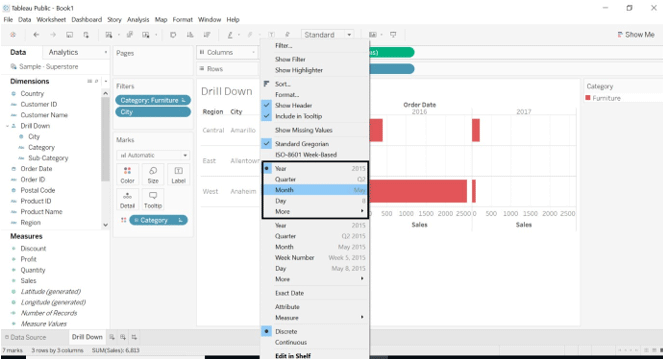
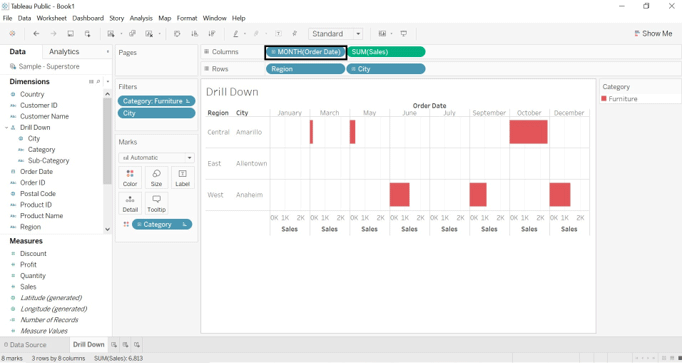
- If we select Month, the result will be changed.
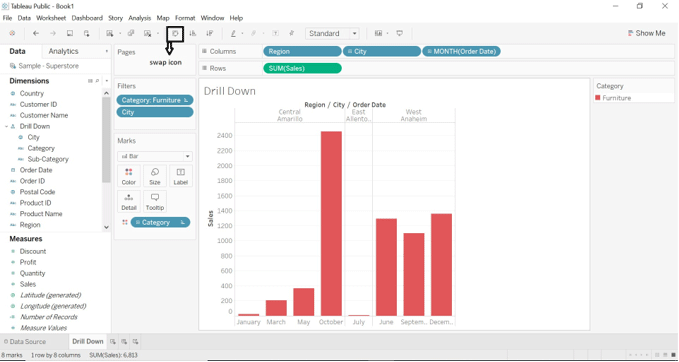
- If we drag the Order Date dimension into rows.
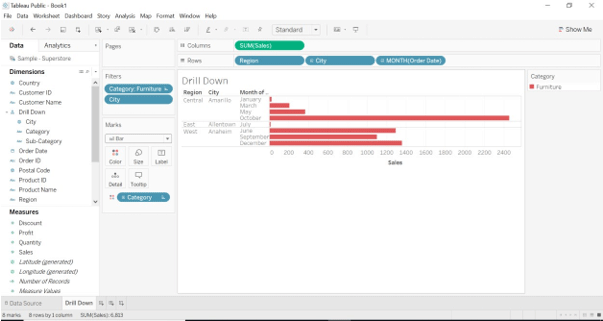
- We can swap the values between columns and rows. A Swap icon is given.
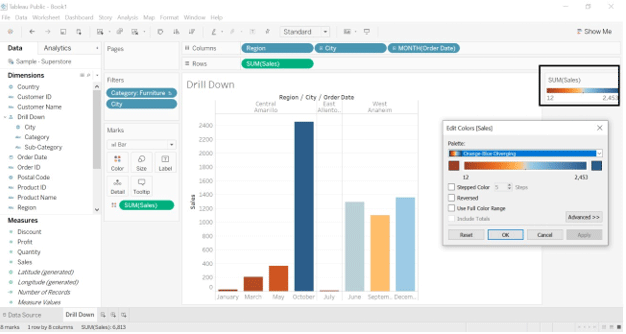
- Drag Sum (Sales) into Color (Marks), a new window will get generated on the right side of the worksheet.
- Click on Sum(sales) -> select drop down -> click on Edit Colors, select the color you want.
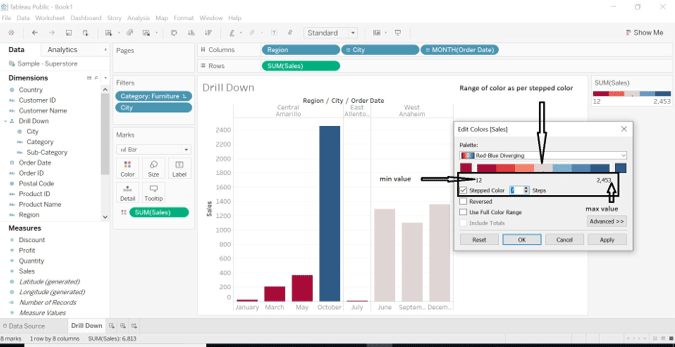
- We can change the color of sales with more advanced color formation features. Open edit color windows. Click on Stepped Color, we can change a number of steps, and the color palette will show a range of color as per the steps we have chosen.
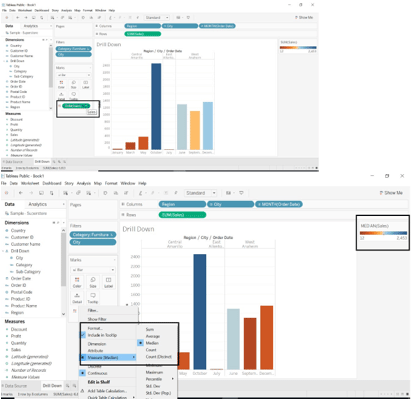
- We can change SUM(Sales) to average, median, count, minimum, maximum, etc. measure.
- Click on the drop-down button of SUM(Sales)->select Measure (SUM)->select measure you want.
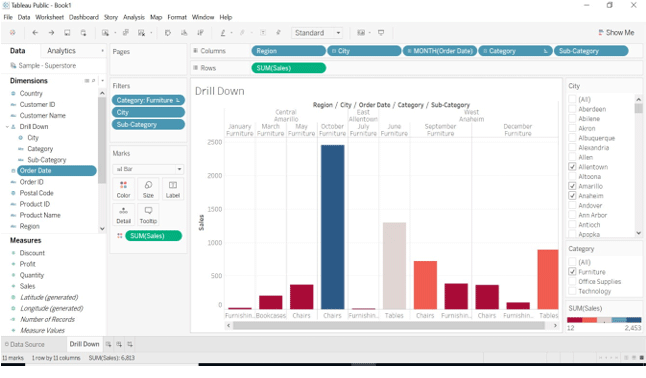
- We have dragged category and sub-category dimension into columns. We have opted for the Furniture category and selected all the sub-categories.
- Select dimension->click on drop-down arrow->select show filter->new window will open on the right side of the worksheet.
- We can select any data created on the right side and display the result we want.
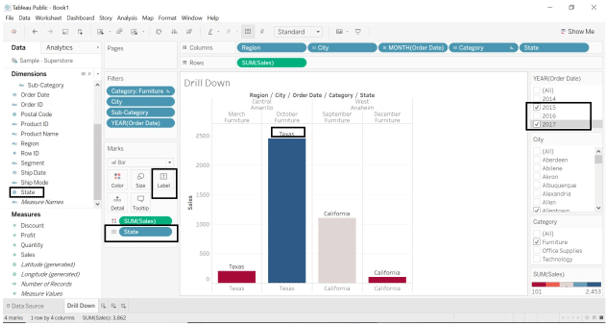
- Drag State dimension into Label; it will display data state wise.
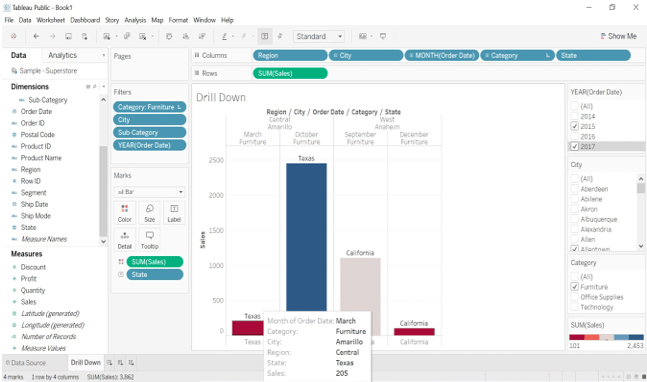
- We have selected the year date – 2015 and 2017; data will be shown for these two years only.
- We have seen some of the sales for each region, category, state.
Create Map View
- As a first step, create a hierarchy with Postal code, state, and country dimension.
- Go to Country->click on drop-down bar->select Hierarchy->Create hierarchy->give a name to hierarchy (we have given name as the map).
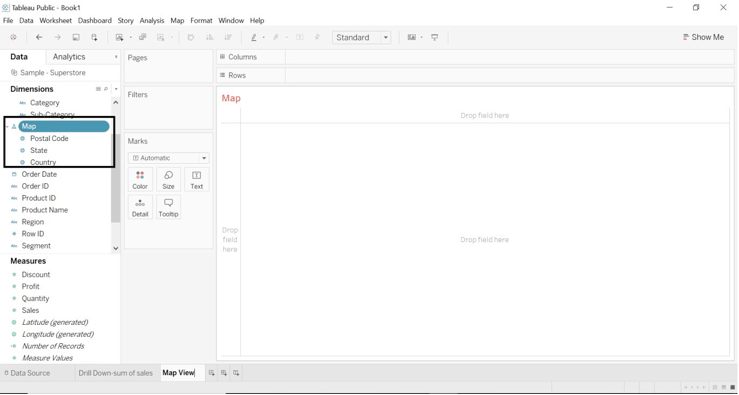
- Double click on state dimension or drag state dimension to label, Map will get created.
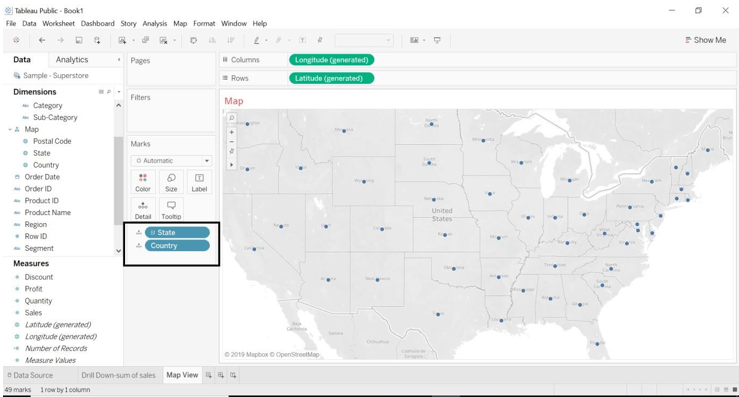
- Tableau automatically created a map because tableau knows the state is geographic data.
- The County dimension is added by default because, in a sample database, the country is part of the hierarchy.
- Each level of the hierarchy is added to the details.
- Each location is needed for a map view that the reason longitude and latitude are added.
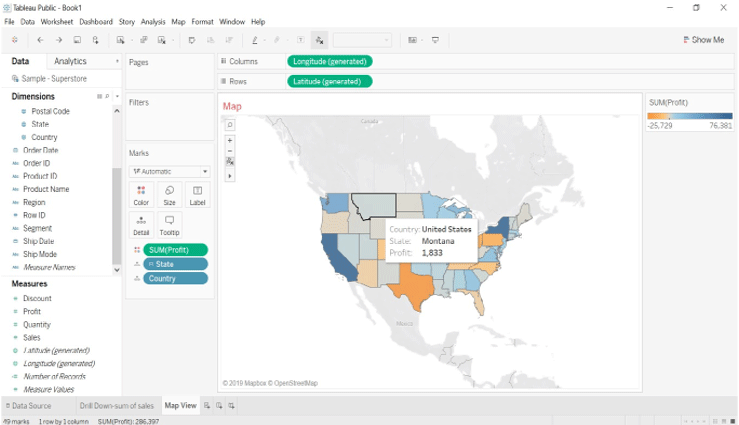
- Drag Profit measure to color, we can see some of the profit for each state.
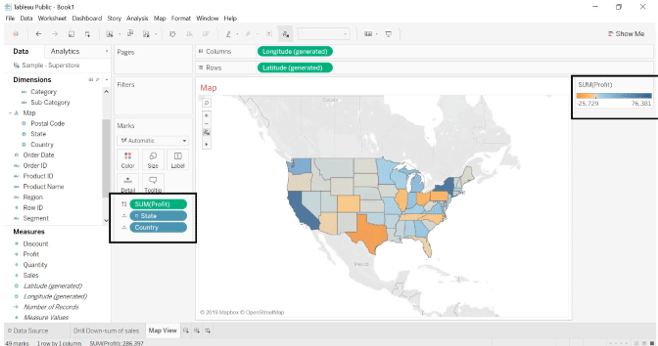
- Color is automatically added for each state based on profit. View automatically updated filled map.
- We will drag the region dimension into filters. We can see a profit by region wise.
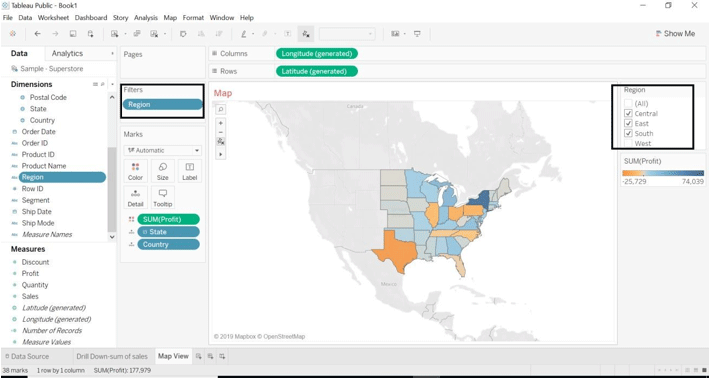
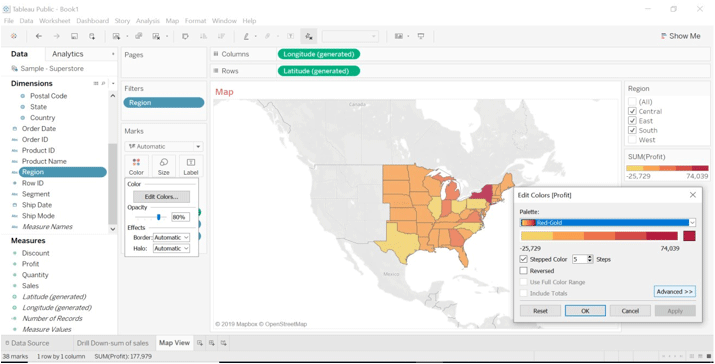
- We can change the color of profit; we can see what profit each state is getting.
- Go to Color->Edit color->Select stepped color->select color (from color palatte).
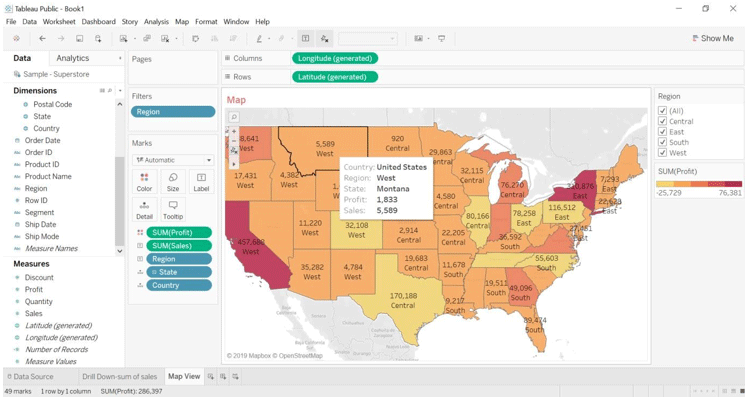
- Drag Sales measure and region dimension to Label; we will get to see a sale for each state and region.
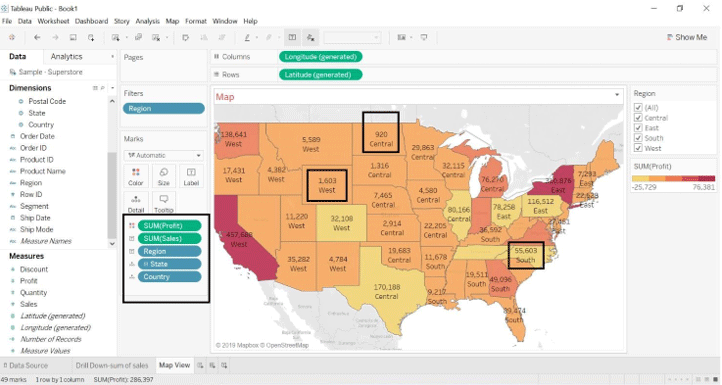
- We can see in the below image sales a profit for the state with region and country.
Drill Down with Map
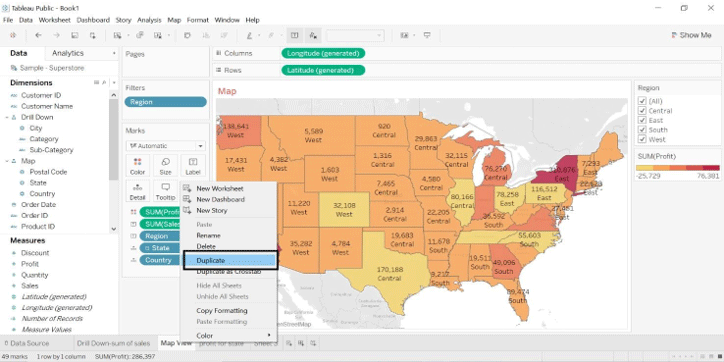
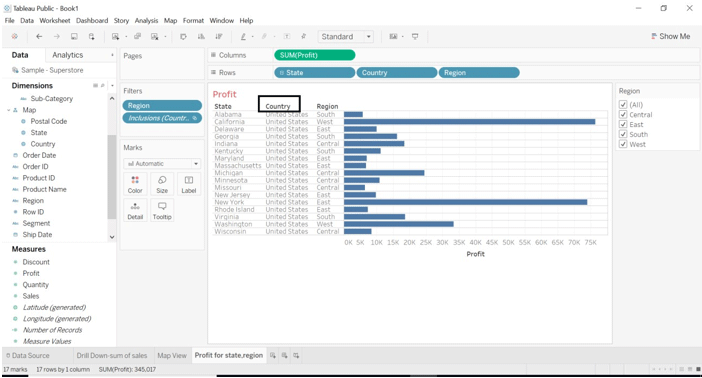
- We will see the profit for each region with a drill-down approach.
- Copy map view worksheet. Click on worksheet->click on a duplicate.
- Duplicate sheets will be created.
- Go to show Me -> select bar graph.
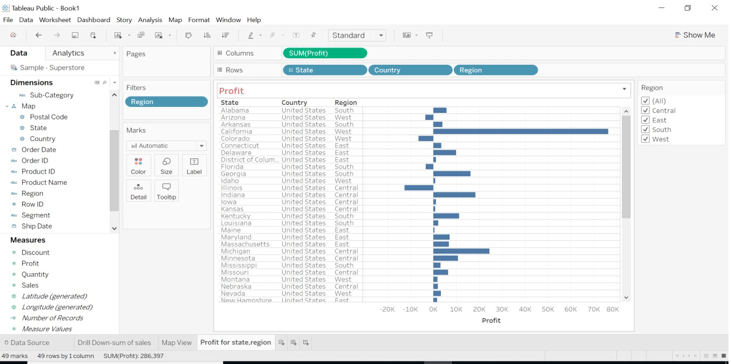
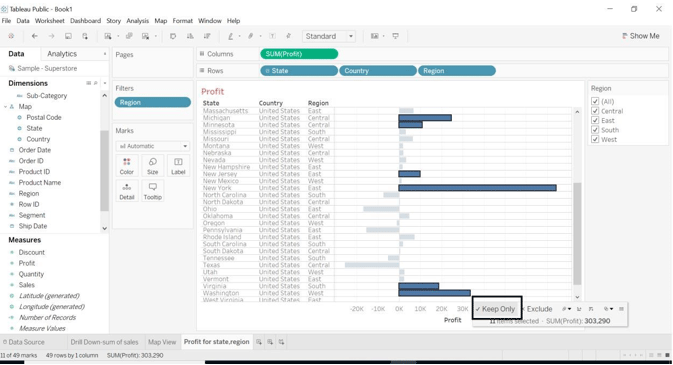
- Select the profit area and mark keep only.
- When we select keep Only, the below image will appear.
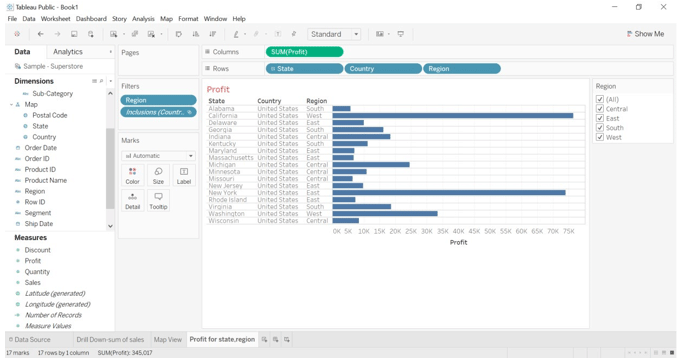
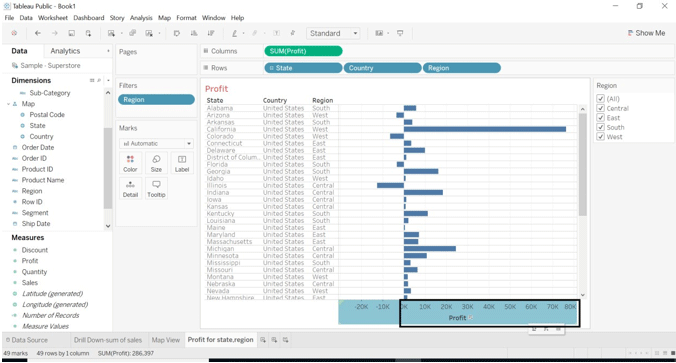
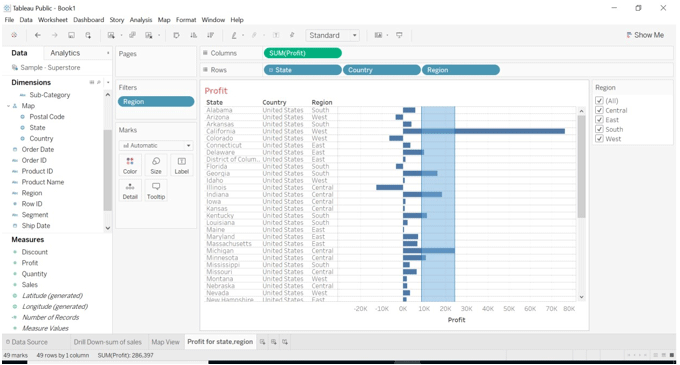
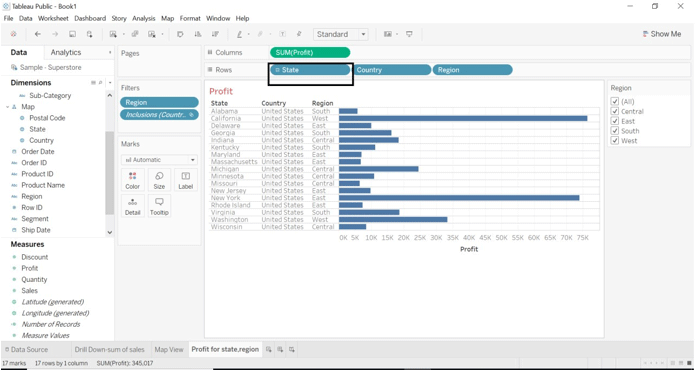
- When we click on state measure, the country will come under state because we have made a hierarchy of it. – sign with the state is given. When we click on – sign country will disappear will rows.
- When – sign with the state.
- When + sign with the state.
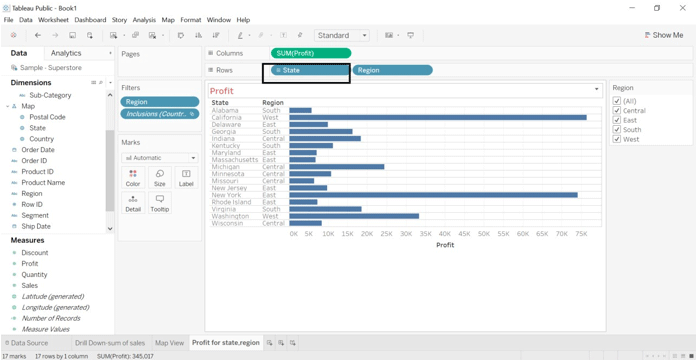
- If we click on + sign on the state, a date will be shown country wise.
Conclusion- Tableau Drill Down
Drill Down is one of the most useful features tableaus has offered. Visualization makes it easy to view with it. When there is a large data source, we can view each data by using the drill down. Tableau is easy to use tool, easy to understand each feature it provides.
Recommended Articles
This is a guide to the Tableau Drill Down. Here we have discussed the Introduction along with Create Map View and Drill Down the Map. You can also go through our other suggested articles to learn more–
