Updated March 24, 2023
Introduction to LOD Expressions in Tableau
In this article, we will discuss LOD Expressions in Tableau. A visual analytics tool doesn’t just impart users the ability to generate visual insights from data. Rather, it also provides them the ability to aggregate data as per the requirement. However, performing the task of data aggregation isn’t simple in every situation, and sometimes certain technical and functional complexities may be involved. To take the task of aggregation further, the concept of aggregation at the view and calculation-based aggregation comes into the picture. Here, dimensions act as levels that affect the aggregation. In Tableau, the concept of LOD (Level of Detail) allows manipulating aggregation of a measure based on the requirement.
Types of LOD Expressions in Tableau
There are three types of LOD expressions in Tableau they are as follows.
- FIXED LOD Expression: In this type, the level of aggregation remains fixed, as mentioned in the calculated field.
- INCLUDE LOD Expression: In this type, data can be aggregated on any dimension at view level along with the one mentioned in the calculated field.
- EXCLUDE LOD Expression: In this type, data can be aggregated on any dimension at view level except the one mentioned in the calculated field.
Creating LOD Expressions in Tableau
We’ll now look into the procedure to create and use LOD expressions in Tableau. For this demonstration, we are going to use the Distribution Volume dataset. The dataset contains volume distributed across major regions in India by distribution unit. Important dimensions are the Distribution Unit, Region, DU Code, Mode, and City, while Distribution Volume is the measure in the dataset.
Through the illustrations, we’ll see the applications of the various types of LOD expressions.
Let’s proceed with the demonstration as follows.
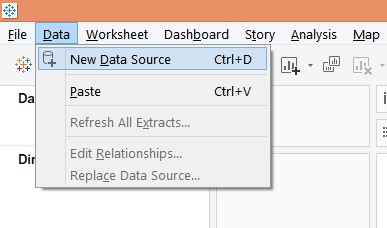
1. Load the requisite dataset into Tableau. For this, click on “New Data Source” under the Data menu. Alternatively, click on “Connect to Data”.
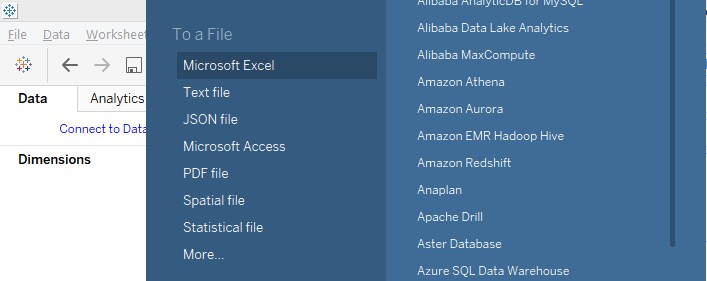
2. From the window that pops-up, select the requisite data source type. In this case, the data source type is MS Excel, so click on Microsoft Excel.
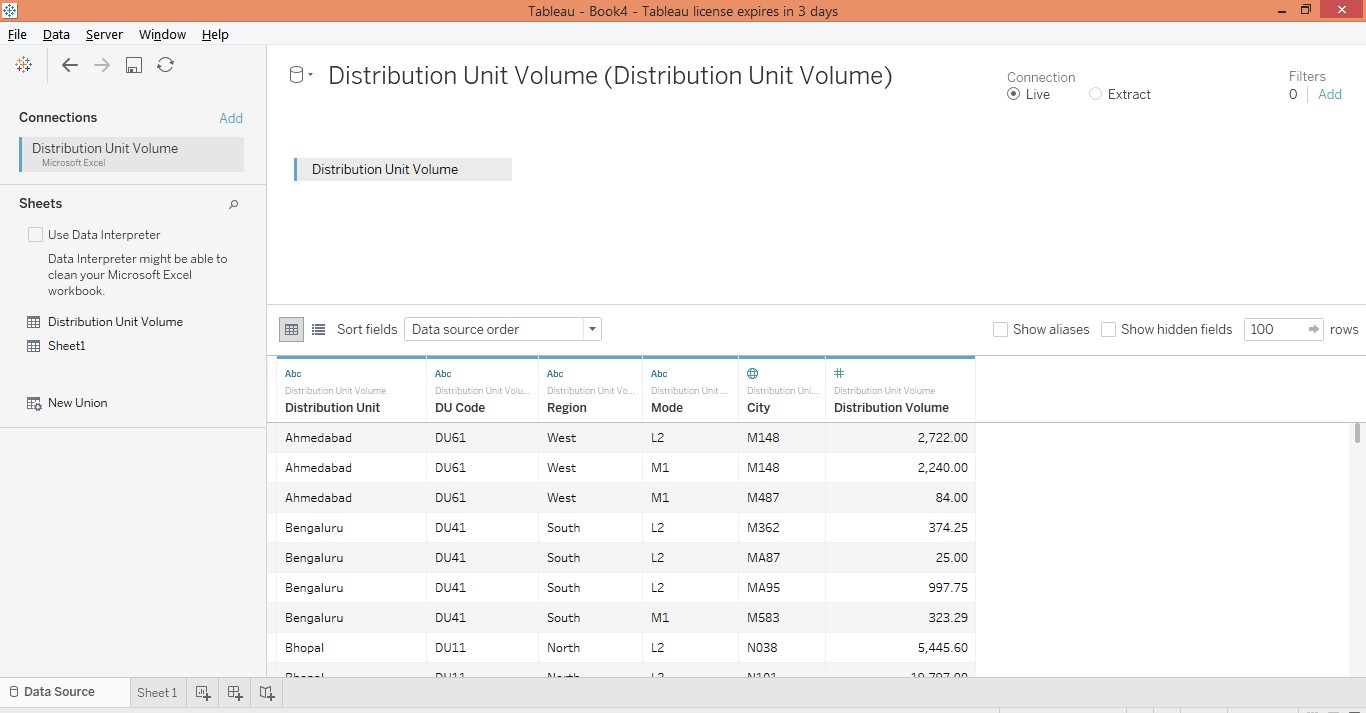
3. The loaded data can be seen in the “Data Source” tab. Examine the data prior to proceeding to the analysis.
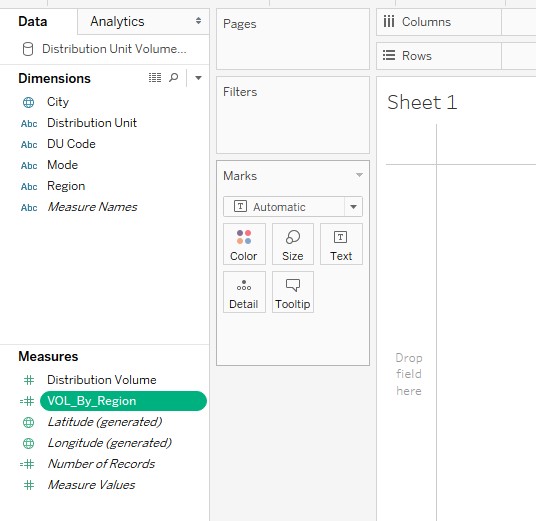
4. Moving to the sheet tab, the dimensions, and the measure can be seen in the respective sections.
5. Now, we’ll be exploring the procedure to implement the three LOD expressions, one-by-one. Initially, just bring dimensions Region and Distribution Unit into Rows region and drag the measure Distribution Volume over Text in the Marks card. We get a tabular representation of data as below. Note, we have got Distribution Volume figures by Distribution Unit by Region.
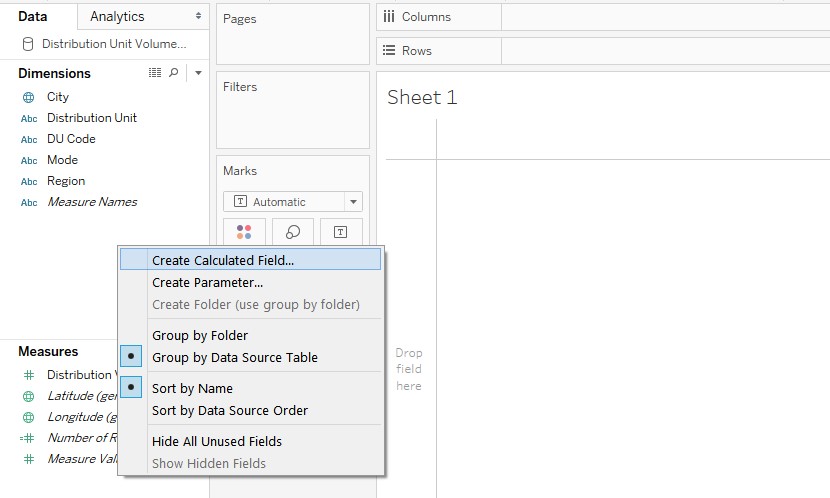
6. In order to create a LOD expression, first, we need to create a calculated field. So, right-click anywhere in the blank portion in the Data tab, and select “Create Calculated Field”, click on that.
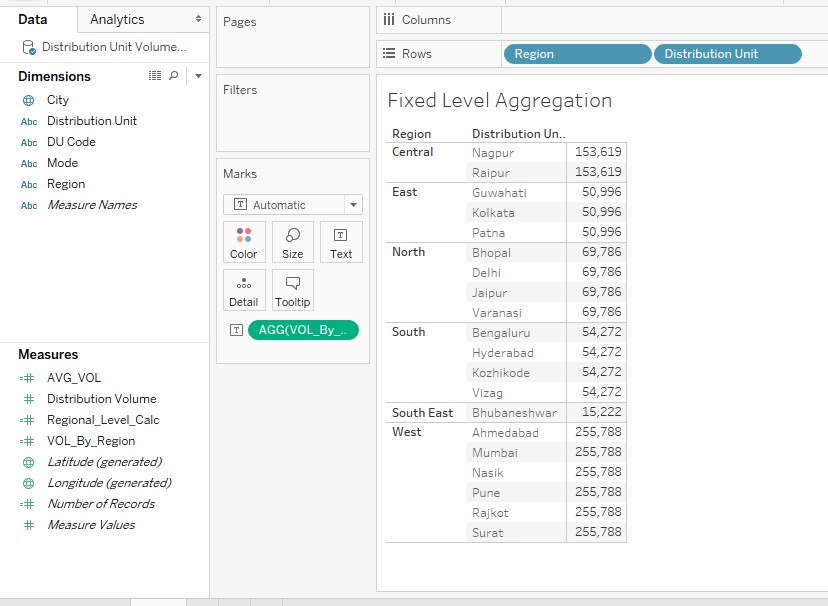
7. In the create field section, observe the following code. The “FIXED” computes an aggregate based on specified dimensions only. So, the following code takes care of the fact that whatever dimension we may include in the analysis, the aggregation will always be done on the Region dimension only.
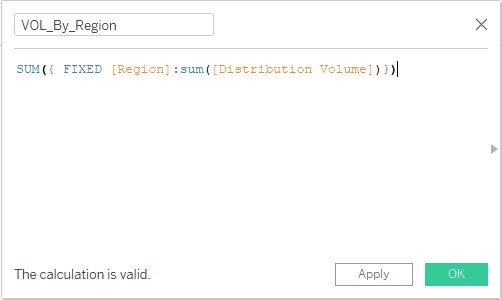
8. The newly created calculated field “VOL_By_Region” can be seen in the Measures section as shown below.
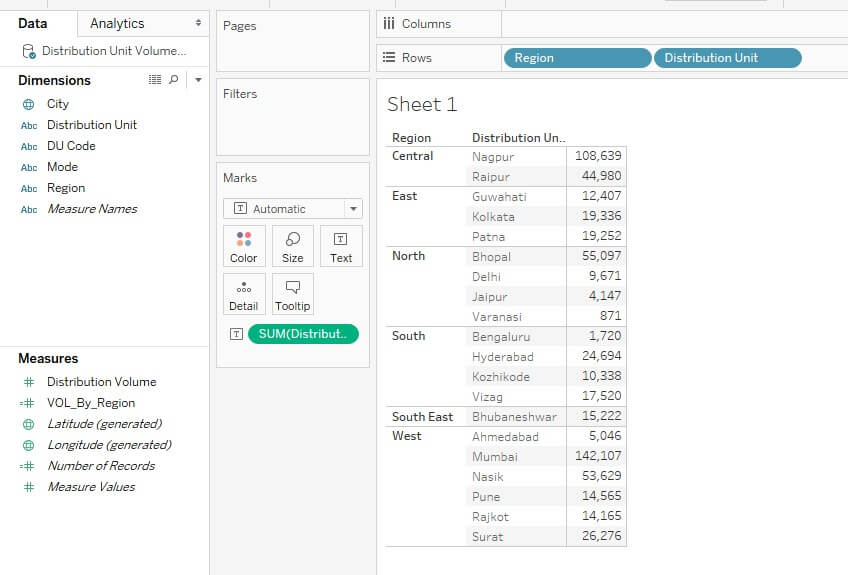
9. Now, bring Region and Distribution Unit dimensions into Rows region and drag VOL_By_Region dimension over Text in the Marks card. The hierarchy for distribution area is Region -> Distribution Unit -> City. However, we can find that distribution units have the same values in a region. This is due to the fact that aggregation has been fixed at the Region level.
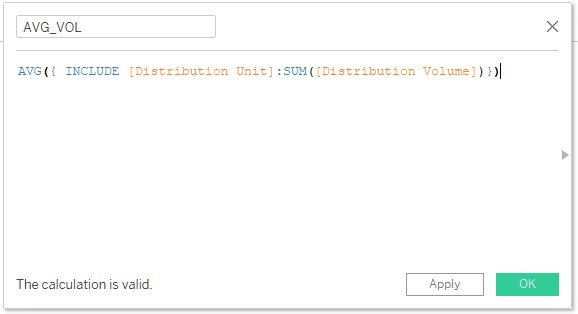
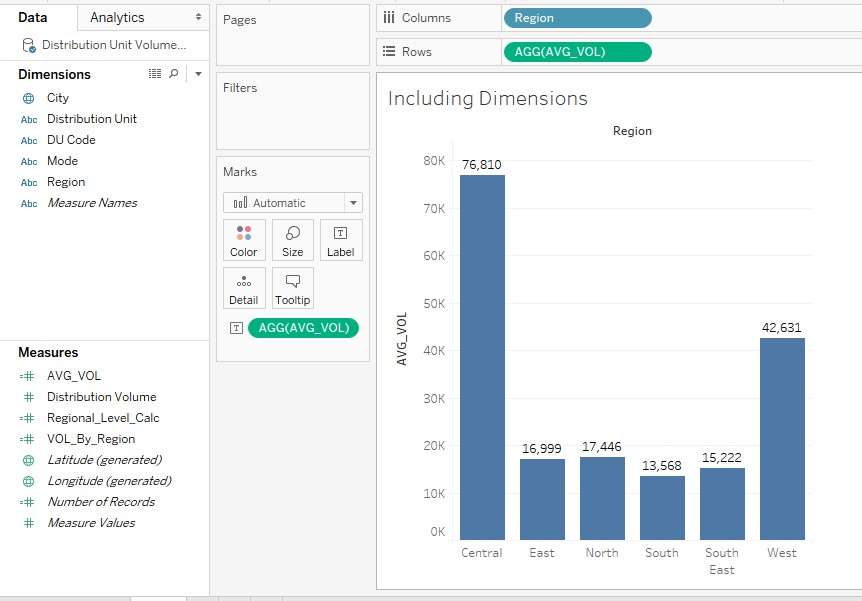
10. Now, we want to fix the aggregation level but ensure that aggregation can be done at other dimensions also at the view level. This can be accomplished by INCLUDE LOD expression. We created a calculated field to achieve this, which is as shown below. Observe, INCLUDE [Distribution Unit] ensures that, now, along with this dimension, average aggregation is possible on other dimensions too.
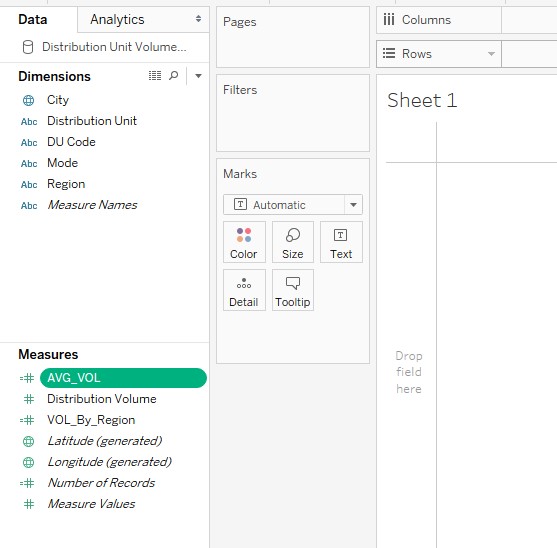
11. The newly created dimension AVG_VOL can be seen in the Measures section. AVG_VOL means average volume by the desired dimension.
12. As can be seen in the below screenshot, we created a vertical bar chart giving Region-wise average Distribution Volume. Note, though in the calculated field the aggregation has been done at lower level dimension, still at view level aggregation by higher-level dimension is possible. This is owing to the INCLUDE LOD expression.
13. Sometimes, we may not be interested or mandatorily not require aggregation done by a certain dimension. In order to meet the condition, we use EXCLUDE as follows. Observe the expression in the following calculated field. EXCLUDE [Distribution Unit] ensures that aggregation by the Distribution Unit won’t work.
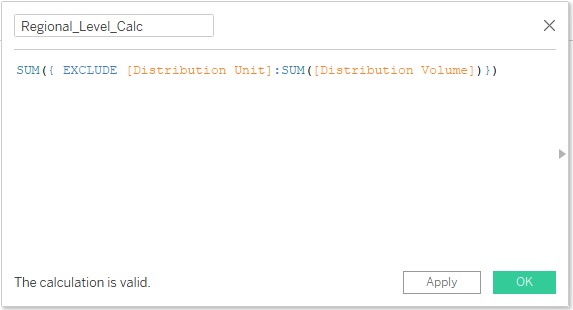
14. The newly created field “Regional_Level_Calc” can be seen in the Measures section. The field has been named so as no aggregation is possible over the Distribution Unit dimension and Regional level analysis will be meaningful.
15. Now, bring the dimensions Region and Distribution Unit into Rows region and drag the newly created field “Regional_Level_Calc” over Text in Marks card. As can be seen in the below screenshot, we get Distribution Unit wise figures by Region. However, the figures correspond to the Region level aggregation.
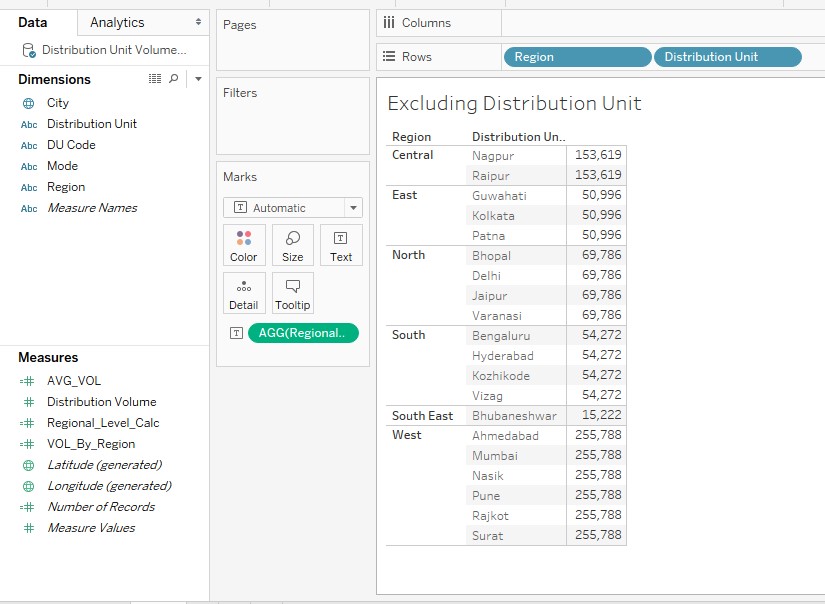
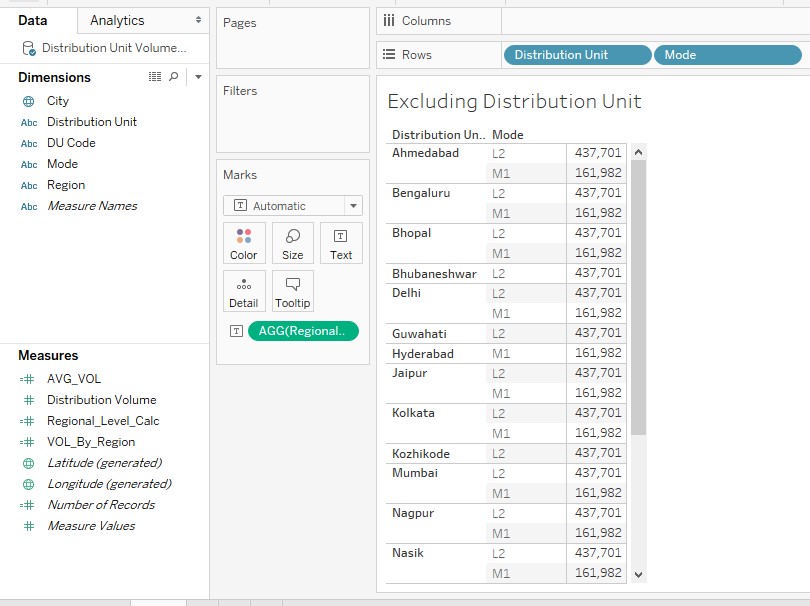
16. The above illustration demonstrating the EXCLUDE application works similar to what FIXED does as we have seen in the preceding section. We’ll include another dimension in the analysis so as to check how EXCLUDE works.
Just observe the following screenshot. We have included dimension Mode into and removed dimension Region from the analysis. Now, we can find that for all Distribution Units, we have got the same Mode wise figures. Ideally, the correct result would have been mode wise figures for that particular distribution unit. However, in this case, while aggregating it takes into consideration the total distribution volume and just aggregates it by dimension Mode. So, essentially, there remains no relevance of including the dimension Distribution Unit in the analysis.
Conclusion
While driving analytics, we never know what type of data aggregation we may require to perform. Typically, data preparation tasks prior to importing data into Tableau will do most of the work. However, in order to deal with unexpected aggregation requirements occurring in certain situations, the concept of LOD proves handy.
Recommended Articles
This is a guide to LOD Expressions in Tableau. Here we discuss the introduction and how to create LOD expressions in Tableau along with its types. You may also look at the following articles to learn more –
