Updated March 22, 2023
What is Tableau Context Filter?
Tableau Context Filter is a special type of filter that controls the data for the other filters. Whereas the normal filters are generally processed all the data rows from data source independent of the associated filters. Tableau creates a temporary table to process the context filter data that is the reason the context filters in Tableau are also known as dependent filters. The context filter is used to improve the processing performance. It is a recommended filter condition in Tableau for large datasets for creating visualizations. The Tableau Context filter should include in the visualization design before adding other filters for optimizing performance.
Creating Context Filters
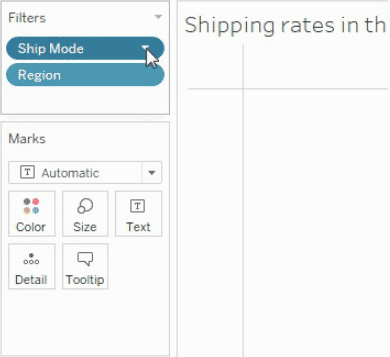
- Create a filter on which you want to create a context filter, by dragging the dimension to the filter shelf. In the following example, ShipMode and Region are the dimensions in the filter shelf.
- Right-click on it and select Add to Context option from the context menu of the existing filter. In this example right-click on the ShipMode dimension and select Add to Context option from the general tab as shown below:
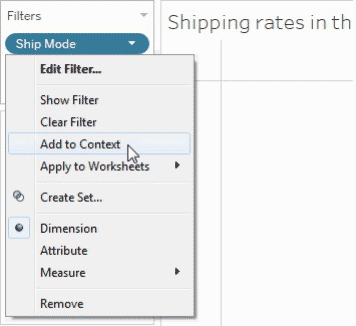
- Context filter appears at the top of the Filters shelf.
- These filters cannot be rearranged in anyways.
- Also, once a filter has become a Context filter, it can be identified by a Grey color in the filter shelf.
- In the example, after adding Context filter to the ShipMode its color got changed to grey as shown below:
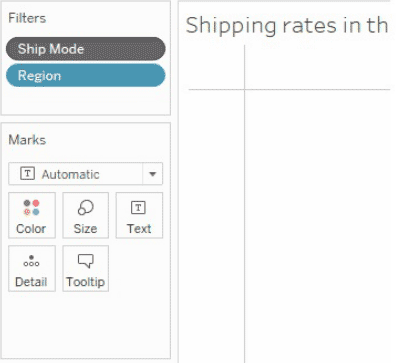
- In the example, the ShipMode dimension has become the context filter. And the Region filter is now calculated using the data that passes through the Ship Mode.
Removing Context Filters
- To remove the context filter, you can right-click on the dimension and select Remove from Context option from the general tab as shown below:
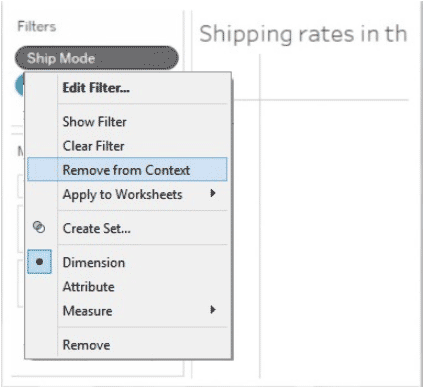
- Now the color will change back to blue as an indication.
- When you remove the context filter, a new context is computed if any other context filter is remaining on the filter shelf.
- After removing the context filter, the filter remains on the filter shelf as a standard filter.
- Whenever you are editing a Context Filter, a new context is computed each time.
Example of Tableau Context Filter
You can consider the superstore sample data set below for the following example.

- This example gives you an idea about the creation and usages of the Context filter.
- First, you can create a normal view and filter the top ten products based on the sale.
- Then, add a context filter on the product category dimension.
- Context filter filters the view and shows the top 10 furniture products.
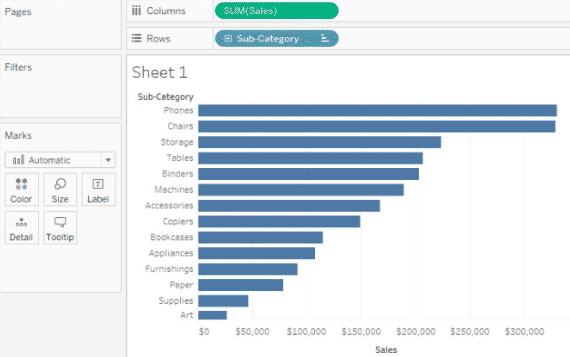
Step 1: Using the SuperstoreSample data set, create an initial view showing the sub-category sales, which is sorted in the descending order of the sales as shown below:
Step 2: Now show the products which are top-selling by creating a top 10 filter:
- Add the field Sub-Category to the filter shelf.
- Right-click on the Sub-Category field and select the Top.
- Now select By field.
- Now choose the Top 10 Sale Sum as shown in the following screenshot:
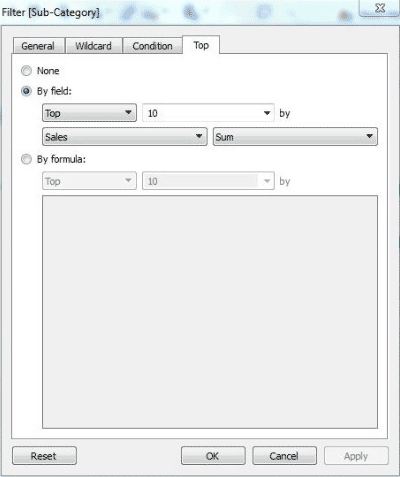
- Click OK when you are done.
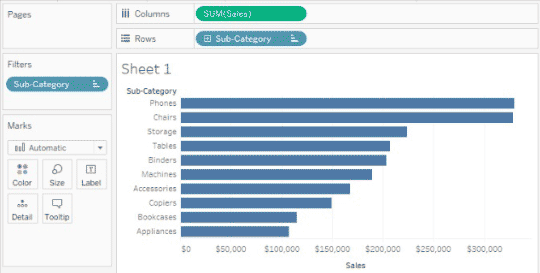
Step 3: Now the view is filtered to show only the top 10 product sub-categories by Sale as shown below:
Step 4: Now you may add one more filter to show one product category, say Furniture.
- Drag the field Category to the filter shelf.
- Select Furniture.
- Click OK when you are done.
The filtered view is shown as in the below screenshot:
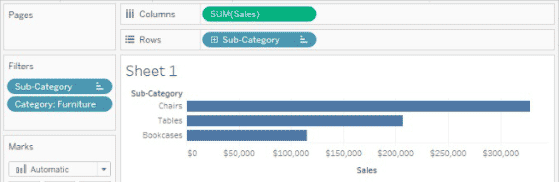
- The filtered view now shows only 3 products instead of 10, because all the filters are independent and are calculated individually.
- From this view, we can see that three products out of the top 10 are furniture.
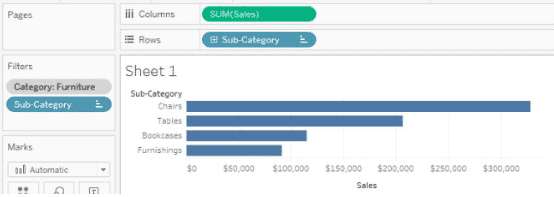
Step 5: Using Context Filter on Category, we can find the top ten products.
- Right-click on the Category dimension on the filter shelf then choose to Add to Context option.
- Now you can see the change in color to grey as identification of Context Filter.
- Also, now you can see only the top four products of furniture from the view because there are only four furniture products in the sub-categories.
- The view can be shown as below:
Advantages of Tableau Context Filter
The advantages of Tableau Context Filter are explained below:
1. Improve Performance
- When you are using many filters simultaneously or you are working on huge data sets, the queries can be slow.
- Context filters can be used in such situations to improve performance because it creates temporary data sets based on the filter criteria.
- The selection of major categorical context filters helps you to effectively improve the performance.
2. Dependent Filter Condition
- Context filters can be used to set dependent filter conditions based on your requirements.
- Context filters should be given priority when the data source is huge.
- You can set context filters to get the data of interest alone, and then set a dependent numerical or top N filter.
Performance Improvement of Tableau Context Filter
- Using a filter that reduces the size of the data set much significantly is better than using multiple filters simultaneously.
- If a filter is unable to reduce the size of data sets by one-tenth or more, then its advisable to not use a filter on such data sets because it affects performance very badly.
- All the data modeling should be completed before applying the filter because each change in the data model, for example, converting the dimensions to measures requires recomputing of the contest every time.
- Use continuous dates if you are setting context on date fields. Using date formats like YEAR (date) or context filter on discrete type dates are also effective.
- You should set all the necessary filters for the context and should create the context before adding fields to the other shelves. It makes the queries run much faster when other shelf fields are dropped.
- Context filters cannot provide performance improvement if your data sets are heavily indexed. It decreases performance.
Conclusion
Context filters are used to improve your query performance. Context filters reduce the size of your data sets to one-tenth or even more. The selection of the number of context filters is also very crucial for the performance. Selecting the type of joins is also important for performance improvement.
Recommended Articles
This is a guide to Tableau Context Filter. Here we discuss how to create and remove context filters, examples and advantages of context filters. You may also look at the following articles to learn more –
