EDUCBA

EDUCBA

MENUMENU
  • Free Tutorials
  • Free Courses
  • Certification Courses
  • 360+ Courses All in One Bundle
  • Login
Home Data Science Data Science Tutorials Tableau Tutorial Tableau Tooltip
Secondary Sidebar
Tableau Tutorial
  • Advanced
    • Tableau Bins
    • Tableau 3D
    • Tableau Export to Excel
    • Tableau Reporting
    • Tableau Reader
    • Tableau Map
    • Tableau Viewer
    • Tableau Prep Builder
    • Tableau Bridge
    • Tableau Tooltip
    • Tableau Hyper
    • Tableau Zen Master
    • Tableau Union
    • Tableau Templates
    • Tableau Alerts
    • Tableau Reporting Tool
    • Conditional Formatting in Tableau
    • Tableau Web Data Connector
    • Tableau BI Tool
    • Data Blending in Tableau
    • Parameters in Tableau
    • Tableau Data Sets
    • Creating Set in Tableau
    • Tableau Drill Down
    • Tableau Dynamic Parameters
    • Tableau Table Calculation
    • Tableau Visualization
    • Tableau Joins
    • Pivot in Tableau
    • Data Visualization With Tableau
    • Forecast in Tableau
    • Map Layers in Tableau
    • Group in Tableau
    • Tableau Group by
    • Hierarchy in Tableau
    • Sets in Tableau
    • How to create a Set in Tableau
    • Tableau Order of Operations
    • Tableau User Group
    • Tableau Calculated Field
    • Custom SQL in Tableau
  • Basic
    • What is Tableau
    • What is Tableau Dashboard
    • What is Tableau Server
    • Uses of Tableau
    • Tableau Versions
    • Tableau Architecture
    • Is Tableau Free
    • Tableau New Features
    • How To Install Tableau
    • How to Use Tableau?
    • Install Tableau Server
    • Tableau Commands
  • Charts
    • Tableau Charts
    • Tableau Bar Chart
    • Tableau Chart Types
    • Donut Chart in Tableau
    • Tableau Gauge Chart
    • Funnel Chart in Tableau
    • Gantt Chart in Tableau
    • Bubble Chart in Tableau
    • Pareto Chart in Tableau
    • Sankey Chart In Tableau
    • Stacked Bar Chart in Tableau
    • Tableau Bullet Chart
    • Waterfall Chart in Tableau
    • Line Chart in Tableau
    • Heat Map in Tableau
    • Histogram in Tableau
    • CrossTab in Tableau
    • Treemap in Tableau
    • Trend Lines in Tableau
    • Tableau Reference Lines
    • Tableau Dual Axis
    • Legend in Tableau
    • Pie Chart in Tableau
    • Tableau Storyline
  • Statement
    • Tableau IF Statement
    • Case Statement in Tableau
  • Functions
    • Tableau Functions
    • Tableau String Functions
    • Concatenate in Tableau
    • Rank Function in Tableau
    • Tableau Aggregate Functions
    • Window Sum Tableau
    • LOD Expressions in Tableau
    • LOOKUP Function in Tableau
    • Tableau Fixed Function
    • Tableau Count Distinct
    • Tableau Window Functions
  • Sort/Filters
    • Sorting in Tableau
    • Filters in Tableau
    • Types of Filters in Tableau
    • Tableau Action Filter
    • Context Filter in Tableau
    • Tableau Parameter Filter
    • Adding Filters in Tableau Dashboard
    • Tableau Context Filter
  • Tableau Dashboard
    • Dashboard in Tableau
    • Tableau Dashboard Examples
    • Tableau Dashboard Creation
    • Tableau Dashboard Design
    • Tableau Workbook
  • Interview Questions
    • Tableau Interview Questions

Related Courses

Tableau Certification Course

Business Intelligence Courses

Data Visualization Courses

Tableau Tooltip

Tableau Tooltip

Definition of Tableau Tooltip

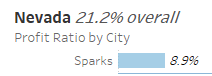
Tableau tooltip has the details which are visible when the user hovers the specific visualization. The tooltip provides multiple affordable tools to easily filter the information by either choosing or excluding the selected information, or selection of different groups or it helps to explain the views of underlying data. A tooltip gives an informative message which gives the idea to a user when he starts to interact with a single element in the graphical user interface. Tooltip can be initiated in dual ways, one is by using the gesture of mouse hover and the other is keyboard hover gesture. In this article, the features and application of the tooltip are discussed in brief.

Overview of Tooltip

In simple, the tooltip is used to give brief information to the user, when he gives the mouse or keyboard hover in the specific content or image in the GUI. Tooltip can be linked to all the active components like text links, buttons, icons, etc. It explains the linked component. Hence the tooltip is wide specific and contextual which doesn’t explain the entire task or the bigger view of the picture. The important perspective of the tooltip is it is user-triggered. The tip is popped on the pages to give attention to the user about the advanced feature and its specific functionality. As it can be triggered by a hover gesture, it is used only with a keyboard or mouse. But it does not apply to touchscreen devices. So the future of the tooltip is to initiate eye-tracking on smart devices where the user has to gaze at the specific element for a limited duration.

How to create a tableau tooltip?

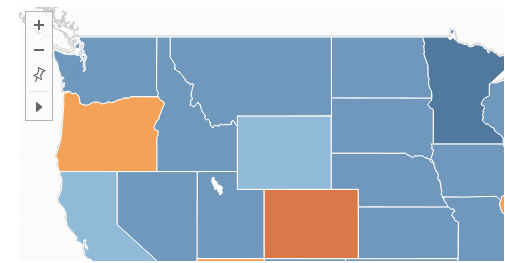
The viz in the tooltip enables the user to reveal more information about the specific content to the user rather than showing the text details within the tooltip. It helps to embed the visualization when the user hovers the certain mark and it gives the details from other visualization present in the mark.

  1. In the source workspace, create a visualization and give a suitable name.
  2. Then in the target workspace, create a visualization and give a name.

Tableau Tooltip 1

Start Your Free Data Science Course

Hadoop, Data Science, Statistics & others

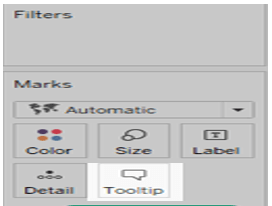
  1. Open the shelf of the tooltip in the source workspace.

Tableau Tooltip 2

4. In the Insert menu, choose the visualization in both the source and target workspace.

Tableau Tooltip 3

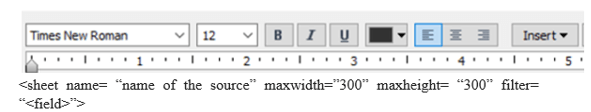
5. The viz tooltip has the default size of 300 by 300 pixels and the user can change it manually the max height values and max-width values according to the requirement.

All in One Data Science Bundle(360+ Courses, 50+ projects)
Python TutorialMachine LearningAWSArtificial Intelligence
TableauR ProgrammingPowerBIDeep Learning
Price
View Courses
360+ Online Courses | 50+ projects | 1500+ Hours | Verifiable Certificates | Lifetime Access
4.7 (86,408 ratings)

Tableau Tooltip 4

Tableau Tooltip 5

  1. Once the view is created in tableau, the tooltip is added by default. Further customization can be done by the user according to his requirement.

Tableau Tooltip 7

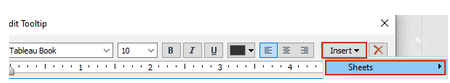
7. In the tooltip, the font and its size can be changed. The alignment and color of tooltip details can be edited.

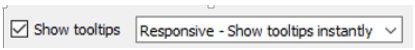
8. Initialization of tooltip can be set either as hover responsive or not. It can also include the hidden command buttons.

image

9. By using the insert option, the user can add dynamic text values, like sheet properties, name, field values, etc.

Rules of tableau tooltip

The user should not find the tooltip to finish the task. It is the best practice when it serves only with additional information. It is implemented for the unfamiliar user to get the basic knowledge about the form field. So when the tooltip disappeared, the direct information should not be present in the tooltip. Hence the user should not depend on the tooltip as the vital one to complete the task.

The tooltip should be customized only with helpful brief content. Redundant text is not encouraged as it leads to information pollution and is a waste of time for the user.

Tooltips are designed for micro-content. So the related short text would be sufficient instead of keeping multiple long lines.

Customize the tooltip with both keyboard and mouse hover which can be accessed by all means of the user.

The arrows are added advantage to the tooltip to identify where the element is linked. When multiple elements are clubbed in the GUI, the arrows are helpful to avoid confusion.

Tooltips should be present consistently all through the website. Tooltips are hard to find as it lacks visual nods. So if it is present erratically on the site, people find it easy. If only a few elements need to be highlighted, go for popup tips.

Most icons are placed as uncertain ones, which is not required in that place. So tooltip can be placed for the unlabelled icon. So instead of giving multiple text labels, the user can give a unique descriptive tooltip.

Make sure that the tooltip should be customized with contrast text against the background. If it’s in contrast to the website page, the user finds it easy to follow the tooltip. It also helps people with visual impairments when they find it difficult to read on white or grey page websites.

Position the tooltip at a certain distance as they should not hide the related content. Test the tooltip position prior, as the mouse or keyboard hover may hide the nearby data.

Tableau tooltip Example

  • The tooltip can be created as per the below steps. And it can be modified by the user guidelines.

image 1

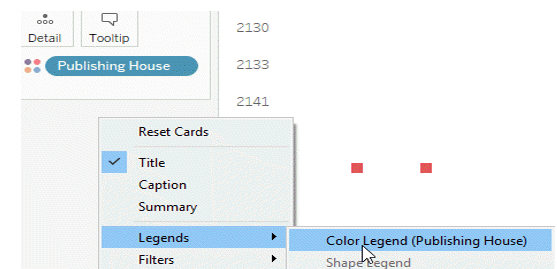
  • Using the insert drop-down option, the dialog box is appeared at the top to insert dynamic text like sheet properties and field values. The all field option in the insert menu is used to update the field parameter and the user can change the view.

Include command options are used to view the filtered data and show the data options.

image 2

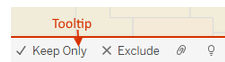
  • If the user, selects the include command option, he can keep only, view data, and exclude options to the tooltip. The command options are present in both tableau desktop and mobile devices. If the user unchecks the include command, it hides the summary and selects multiple marks.

image 3

Conclusion

If the user chooses to allow selection by category, he can select multiple marks with the same values by choosing the discrete field in the tooltip. Hence, by using tooltip the user can make additional details to the guest to complete the task successfully.

Recommended Articles

This is a guide to Tableau Tooltip. Here we discuss the definition, overview, rules, How to create a tableau tooltip, examples with code You may also have a look at the following articles to learn more –

  1. Tableau Gauge Chart
  2. Tableau Bridge
  3. Tableau vs Spotfire
  4. Tableau Web Data Connector
Popular Course in this category
Tableau Training (8 Courses, 8+ Projects)
  8 Online Courses |  8 Hands-on Projects |  55+ Hours |  Verifiable Certificate of Completion
4.5
Price

View Course

Related Courses

Business Intelligence Training (12 Courses, 6+ Projects)4.9
Data Visualization Training (15 Courses, 5+ Projects)4.8
0 Shares
Share
Tweet
Share
Primary Sidebar
Footer
About Us
  • Blog
  • Who is EDUCBA?
  • Sign Up
  • Live Classes
  • Corporate Training
  • Certificate from Top Institutions
  • Contact Us
  • Verifiable Certificate
  • Reviews
  • Terms and Conditions
  • Privacy Policy
  •  
Apps
  • iPhone & iPad
  • Android
Resources
  • Free Courses
  • Database Management
  • Machine Learning
  • All Tutorials
Certification Courses
  • All Courses
  • Data Science Course - All in One Bundle
  • Machine Learning Course
  • Hadoop Certification Training
  • Cloud Computing Training Course
  • R Programming Course
  • AWS Training Course
  • SAS Training Course

ISO 10004:2018 & ISO 9001:2015 Certified

© 2022 - EDUCBA. ALL RIGHTS RESERVED. THE CERTIFICATION NAMES ARE THE TRADEMARKS OF THEIR RESPECTIVE OWNERS.

EDUCBA
Free Data Science Course

SPSS, Data visualization with Python, Matplotlib Library, Seaborn Package

*Please provide your correct email id. Login details for this Free course will be emailed to you

By signing up, you agree to our Terms of Use and Privacy Policy.

EDUCBA Login

Forgot Password?

By signing up, you agree to our Terms of Use and Privacy Policy.

EDUCBA
Free Data Science Course

Hadoop, Data Science, Statistics & others

*Please provide your correct email id. Login details for this Free course will be emailed to you

By signing up, you agree to our Terms of Use and Privacy Policy.

EDUCBA

*Please provide your correct email id. Login details for this Free course will be emailed to you

By signing up, you agree to our Terms of Use and Privacy Policy.

Let’s Get Started

By signing up, you agree to our Terms of Use and Privacy Policy.

This website or its third-party tools use cookies, which are necessary to its functioning and required to achieve the purposes illustrated in the cookie policy. By closing this banner, scrolling this page, clicking a link or continuing to browse otherwise, you agree to our Privacy Policy

Loading . . .
Quiz
Question:

Answer:

Quiz Result
Total QuestionsCorrect AnswersWrong AnswersPercentage

Explore 1000+ varieties of Mock tests View more