Updated July 6, 2023
Introduction to Tableau Reporting
Tableau is one of the fastest and most powerful tools used for visualization purposes. Tableau is a highly interactive solution for business intelligence. With Tableau, anyone can visualize and understand data without any coding knowledge and advanced skills in data science. Features of Tableau Features are: – Easy to use, Greater Insights, Data Visualization, and so on.
Tableau Software was founded in January 2003 by Christian Chabot, Pat Hanrahan, and Chris Stolte. The company is currently headquartered in Seattle, Washington, United States.
How to perform Tableau Reporting?
Before going to the discussion of how we perform reporting in Tableau, let us discuss the Tableau products and the steps about how we can install the Tableau Desktop on our PC.
Tableau Products
Tableau products that are used to design the workbooks and publish them are as below: –
- Tableau Desktop: Creating workbooks, stories, and dashboards will be done in Tableau Desktop. Workbooks created on the Tableau desktop can be shared locally or publically.
- Tableau Public: Tableau public workbooks or dashboards can be accessed and viewed by anyone.
- Tableau Server: For a licensed user to access Tableau reports, we need a server.
- Tableau Online: Tableau Online is similar to the Tableau server.
- Tableau Reader: For users to view the dashboards developed on the Tableau desktop, we use a Tableau reader.
Installation of Tableau Desktop
We get a free trial version of the Tableau desktop. Below is the path to download the Tableau software.
https://www.tableau.com/products/desktop/download
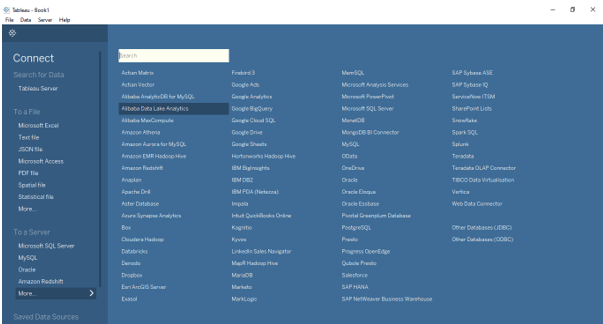
Tableau Data Sources that can be connected with: Tableau can be connected below the type of data sources.
- CSV, Excel, Oracle, SQL Server, DB2, Windows Azure, Google BigQuery, etc, and Other Sources using ODBC.
Screenshot:
Data types in Tableau: Boolean, Date, Date & Time, Geographical values, Text / String, Number (Decimal), and Number (Whole).
Name the file extensions in Tableau:
- Tableau workbook (.twb)
- Tableau Packaged Workbook (.twbx)
- Tableau Data source (.tds)
- Tableau Packaged data source (.tdsx)
- Tableau Data Extract (.tde)
- Tableau Bookmark (.tdm)
- Tableau Map Source (.tms)
- Tableau Preferences (.tps)
Differences between twb and twbx
- A twb is an XML document that contains all the selections and layouts you have made in your Tableau workbook. It does not contain any data.
- A twbx is a zipped archive containing a twb and any extremal files such as extracts and background images.
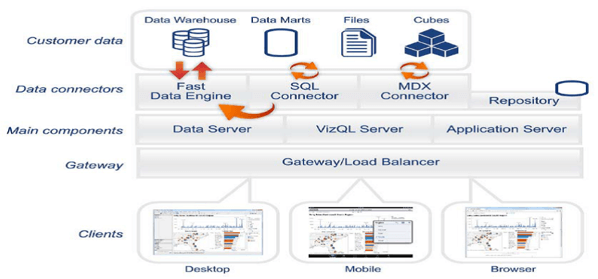
Tableau Architecture
Case study on how to perform reporting in tableau:
Tableau is to connect and extract the data stored from various sources. It can pull the data from any database, Excel, PDF, Oracle, or even Amazon Web Services. Below is the process followed: –
- Connect to the database
- The connection can be live or extracted
- Apply filters on the data source level as per business requirements and create worksheets and dashboards.
- Created Dashboards are shared with users in the form of static files.
- Dashboards can be published in Tableau Server.
- Tableau Reader was used for the worksheet reading purpose.
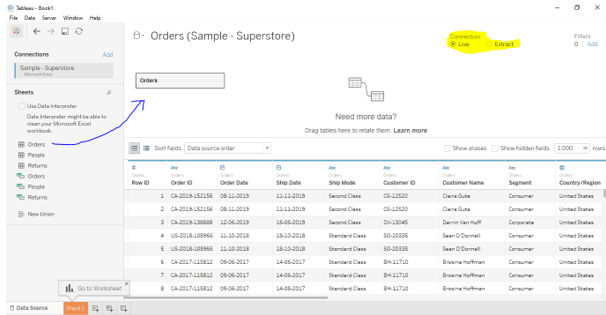
1. Connect to the database
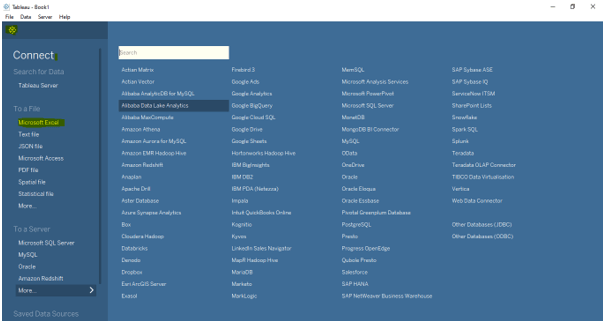
Now let us consider a case in which we use Excel data as a data source. In order to connect to a data source. We need to the data source page below and select the data source that we are planning to connect. In our case, we are planning to connect to ‘Excel’.
Screenshot:
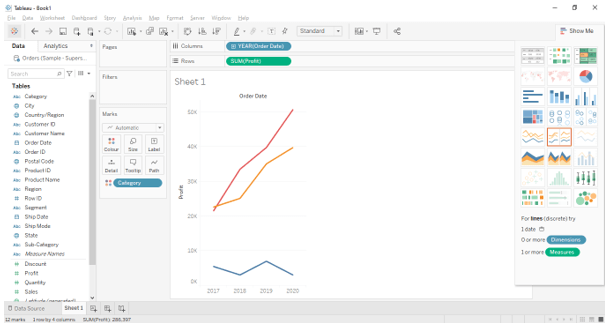
2. Connection can be live or extracted
Live connection: A live connection in Tableau basically means that Tableau queries and reads directly from your database.
Extracts: Extracts are the first copies of the actual data from the original data source. Instead of using a live DB connection, if you use extracts, you will get better performance. However, extracts won’t refresh unless users apply a scheduled refresh on the extract. Drag the required table into the space that you want to use in the dashboard.
Screenshot:
3. Create Dashboards
A dashboard is a collection of several worksheets and supporting information shown in a single place so you can compare and monitor a variety of data simultaneously.
Components of Dashboard: There are mainly five components available in the Dashboard. Those are
- Horizontal
- Vertical
- Image Extract
- Text and WEB [URL Action]
Marks Card
Tool Tip: Tool Tip is a powerful tool. This will be useful for understanding the values and numbers of the associated graph.
- Labels or Text: if you want to see the particular numbers of the associated graph.
- Details: This is related to the color part, but here will get as sections.
- Discrete: Individually separated and distinct
Continuous: forming unbroken value without interruption
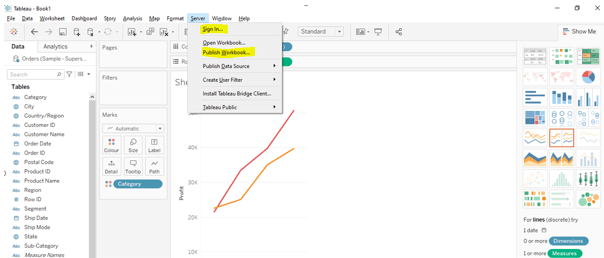
How will you publish workbook in Tableau Server?
Select the ‘Server’ tab and log in to the required server and site. Then you could see the option of ‘Publish Workbook.’ Click on it and ‘Ok.’
Screenshot:
Conclusion
Tableau is a BI Tool. By using this tool, we can convert data into Visualization and a meaningful way to understand the business persons take business decisions.
It’s user-friendly. Why? Because we are not using any coding, just the drag and drop method but we need to think analytically for calculating fields. The normal user also he/ she can open and understand the visualizations. We will get the reports within a short period of time, and we can install them on any OS with no need for any supporting files. We can connect with multiple data sources.
- Diff B/W Excel & Tableau: By using Excel, we can see only one report, and reports are also not much effective, but in Tableau, we can see multiple reports in Tableau with different visualizations.
- Ex: If you want to see the Category and year-wise, we can filter and see the reports within a fraction of the time. Multiple data we can see on flying, but in Excel, we can’t see multiple reports at a time.
Recommended Articles
This is a guide to Tableau Reporting. Here we discuss the Definition, Tableau Architecture, Tableau Products, and How to perform Tableau Reporting. You can also go through our other suggested articles to learn more –
