Updated May 22, 2023
Introduction to Tableau 3D
The following article provides an outline for Tableau 3D. Tableau is a data visualization tool implied in business intelligence and data analysis. In recent times, the tableau has been defined as the head of business intelligence and data analytics. It is used to create charts and graphs and visualize the data via attractive reports and dashboards, which helps to provide meaningful insights. In addition, the business intelligence tool is used to analyze the higher dimensional data. Tableau was acquired by Salesforce and enhanced to an advanced version, making it more user-friendly.
What is Tableau 3D?
Tableau provides unique and exciting features, making it the most popular tool in business intelligence. It aids the user in creating various graphs, charts, dashboards, maps, and stories to visualize and analyze the data to make an effective decision. The salient features which are unique in the tableau are discussed below, and this makes it a powerful tool in business intelligence. In addition, the consequential data exploration and powerful data discovery in tableau enabled the user to respond to essential queries in seconds.
It doesn’t require any programming knowledge; the users can access it without relevant experience and begin working on the tableau and creating visualization according to the requirement. Tableau associates several data sources where the other business intelligence tools don’t support them. It enables users to create meaningful insights by blending and concatenating variable datasets. The tableau server helps the centralized location handle all the published data sources in the organization.
Tableau 3D Models
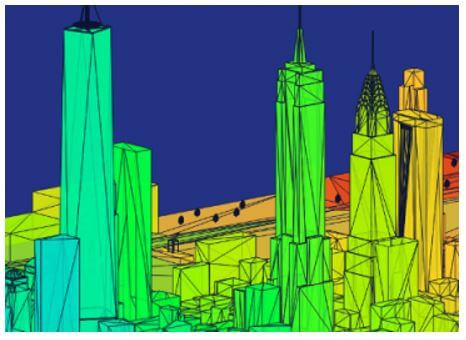
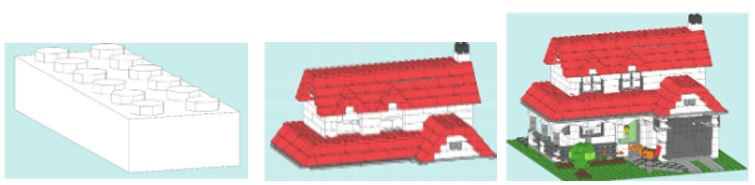
Tableau community is wonderful, where the user can get inspired by its three-dimensional model and attractive features. Several tools are available in a tableau, including a blender, SketchUp, meshlab, etc. These tools support the user to export his model in ASCII stereolithography files which are briefly explained on the official tableau website. Every row in the STL file denotes a format that works, and the vertex is applied in the triangle where the polygon has three vertices. Then, the flow changes the STL file format to TDE, a tableau data extract.
To fetch the data, the user doesn’t need to be aware of python or alteryx.STL file. It can be brought directly from an excel sheet. The.STL format comprises data with X, Y, and Z as vertex coordinates, and every polygon has three vertices.STL is availed as text format where it can be accessed like notepad. The.STL file looks like the excel sheet.
The user should give the representation of rows with vertex, and prefixes should be mentioned. In addition, it helps to provide a number for rows.
To implement this, follow the given steps:
First, fix the space as a delimiter. Then, the STL file should be opened in Excel.
After finishing this, filter the data and select the vertex from the column by eliminating the other rows. Instead of choosing the filter, the user can sort the column and delete every row which is not vertex.
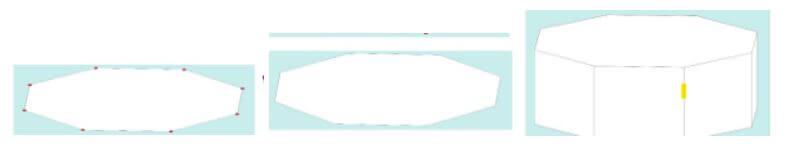
The new column should be added before the column and the vertice_id and the finite numerate rows. It should be unique to identify the vertex quickly.
Add other columns, the polygon_id should be calculated, and the result helps to identify the polygon’s properties.
Then rename all the columns or remove the column apart from the value set.
Save the file in .csv format or .xlsx and link to data in tableau.
Now mention the fields of X, Y, and Z to create a preview and ensure the model is correct.
In the image, the polygons and their values are sorted in ascending order on Y-axis and can be explained in the painter’s algorithm. Here, the depth of the painter’s algorithm is arranged in descending to ascending values. For the rotation of images, the user has to provide the value for three vertices, angle XY, angle XZ, and angle YZ. The calculations for z-axis rotation, y-axis rotation, and x-axis rotation should be given to calculate the plane projection. Value of X, Y, and Z should be used for model rotation. It is up to the user to choose to add colors.
Hence the 3D model is completed.
How to Create Tableau 3D?
All the standards are dependent on. For example, STL models don’t hold any data about the properties and color of the polygon. There is a varied format in 3D like KMZ, FBX, DAE, and OBJ, and all it lies when the triangle has greater than three vertices which hold the data about groups and texture of polygons. But it is easy and efficient to work in OBJ format; hence the format is open. It can be accessed in text format and opened in notepad. To convert and understand the. CSV format works better than other formats. Hence it is widely available with different kinds of models.
There are five significant steps involved in 3D tableau creation. They are data preparation, bar calculation, and shape calculation, and the final step is 3D chart creation.
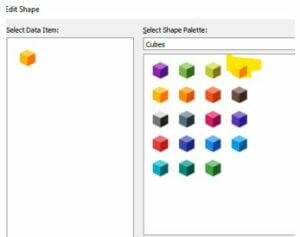
The custom shape should be downloaded according to the user’s preference.
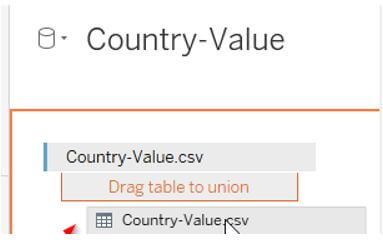
The data source should be imported from the website.
The path should be created.
IF [ name of the table ] = { MIN [ name of the table ] }
Then 0, else 1000 a chosen end.
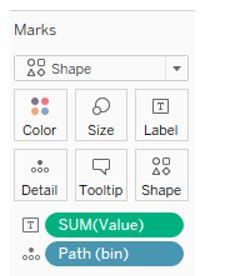
The bin should be created from the path. The minimum value should be given to the bin.
The row should be set along with the path.
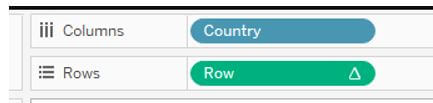
The country column should be moved, and it should be filled with missing values.
Finally, shapes should be selected per the data marks and applied to the worksheet.
Conclusion
The.STL format with a 3D model works in tableau, and the rendering performance is good.OBJ model and the performance monitoring are good.OBJ format. The discrepancies of.OBJ format has occurred in a cyclic overlapping format. The.OBJ format is in sequential order, with several meshes, faces, and vertices. Each part is enumerated, and it works effectively on STL files. The excel files can be scripted as the same as python files. For every 3D image, the goal should be achieved with proper vertices, faces, groups, meshes, and colors.
Recommended Articles
This is a guide to Tableau 3D. Here we discuss the introduction, models, and how to create tableau 3D. You may also have a look at the following articles to learn more –
