Updated March 21, 2023
Introduction to Tableau Aggregate Functions
Tableau is not just a tool that makes graphs and reports, the optimum the data representation we do need the Functions in Tableau. By accessing this function just click the select aggregate from the column drop-down list to make the Create Calculated Field. Below are some of the Tableau Aggregate Functions list:
- Number Functions
- String Functions
- Date Functions
- Type Conversion Functions
- Aggregate Functions
- Logical Functions
From the above, we’ll see more detail about Aggregate Functions which is most commonly using.
Aggregate Functions
Aggregate functions are built-in functions that allow you to summarize or change the granularity of your data. Following are the various Aggregate functions in Tableau:
1. AVG
Average functions return the mean of all values in expression and can be used with numeric fields only.
(Note: it will ignore the NULL values)
Syntax: AVG (expression) | Example: AVG ([Sales]) = 186
2. ATTR
The functions only return the single value for the calculated row and the NULL values can be ignored. If the condition is not meet, it will return the asterisk value.
Syntax: ATTR (expresstion) | Example: ATTR ([country]) = India
3. COLLECT
COLLECT function can be used for spatial fields. It will combine the values in the argument fields and NULL values can be ignored.
Syntax: COLLECT (Spatial) Example: COLLECT ([Geometry])
4. CORR
CORR stands for correlation between the two give expressions. When we want to correlate between the two variables, it can return three values 1, 0 and -1. The values 1 represents the positive changes, 0 represents no relationship and -1 represents the negative change
Syntax: CORR (expr1, expr2)
5. COUNT
It will return the number of values present in the selected column and NULL values can’t be counted. Take the best example for this function, making a pivot table in excel by count the values-based category.
Syntax: COUNT (expression) | Example: COUNT ([‘Sales ID’)] = 45613
6. COUNTD
It will return the distinct count for the given column or a group and it will not return a NULL value. These functions will be using the source of MS excel or text or Access.
Syntax: COUNTD (expression) | Example: COUNTD (‘Country’) = 256
7. COVAR
COVER stands for covariance for the given two expressions. The positive covariance indicates the variable is moving towards in the right direction and we can be noticed in the trend. The data can be considered as a random sample.
Syntax: COVAR (expr1, EXPR2)
8. COVARP
This function is similar to covariance but it only biased with the population.
Syntax: COVARP expr1, EXPR2)
9. MAX
The MAX functions return the maximum values for the given expression. Suppose we have to see the maximum age in the given voter list. We could apply this function to see it.
Syntax: MAX (expression) | Example: MAX ([Age]) = 105
10. MEDIAN
It will return the numeric values with the median of a single expression. It will return the middle value for the given expression it will ignore the NULL values.
Syntax: MEDIAN (expression) | Example: MEDIAN (1, 2, 3, 4, 5) = 3
11. MIN
The MIN functions return the minimum values for the given expression. Suppose we have to see the minimum sales rate in the store. We could apply this function to see it.
Syntax: MIN (expression) | Example: MIN ([Sales rate]) = 5
12. PERCENTILE
This function will return the percentile for the corresponding given expression. It only returns values between 0 and 1. Suppose we’ve given a decimal value like 0.54, it will return the median value.
Syntax: PERCENTILE (expression, number) | Example: PERCENTILE ([Sales], 0.54) = 37.69
13. STDEV
It stands for standard deviation function, it will returns if there are any high or low standard deviation values for the average value constrain
Syntax: STDEV(expression)
14. STDEVP
It is similar to the standard deviation but the difference is, it will be based on a population.
Syntax: STDEVP(expression)
15. SUM
We must all know that it is a simple function that calculates the total numbers for the given range of numeric values and it can be ignored NULL values.
Syntax: SUM (expression) | Example SUM (5, 5, 5) = 15
16. VAR
The VAR stands for variance in the given expression.
Syntax: VAR (expression)
17. VARP
It is similar to the Variance but the difference is, it will be based on a population.
Syntax: VARP(expression)
How does Aggregate Function Work in Tableau?
In detail, we’ll see how to use these functions in Tableau:
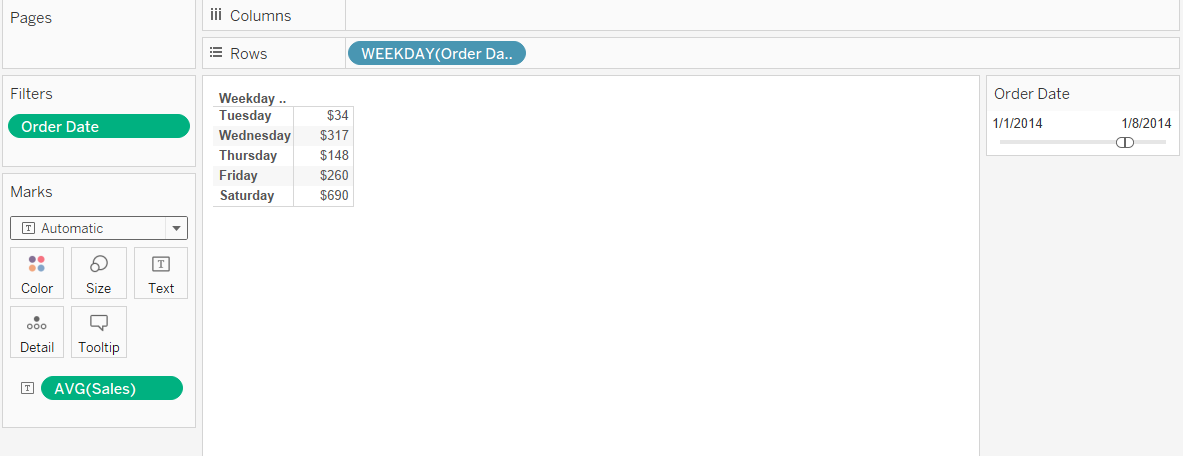
- Open a new workbook in tableau desktop and connect the data sources using the .xls file dataset. Here the dataset we can use any store sales report and calculate the average sales on weekdays. We can simply find the average of sales by drag and drop the date into row field and then make sales in the second column as average (AVG), like below,
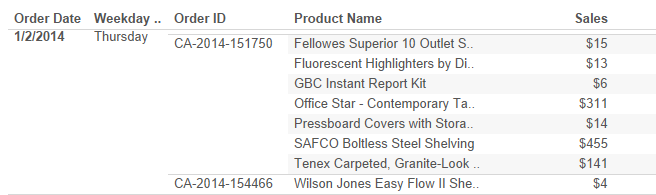
- The problem by making AVG calculations in Tableau is based on each occurrence of the sales. But when we look deeper into the data, each sales having multiple no. of order and different products. The sample figure has been shown below,
- Here we clearly understand the calculation made by the sum of sales and created an average. The Tableau automatically takes as SUM (Sales) / COUNT (Sales). Where we need to customize it to make the average for per day or weekdays, how do we make this? Yes, we need to use the calculated field to have AVG aggregation as SUM (Sales).
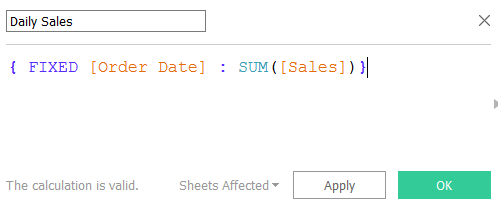
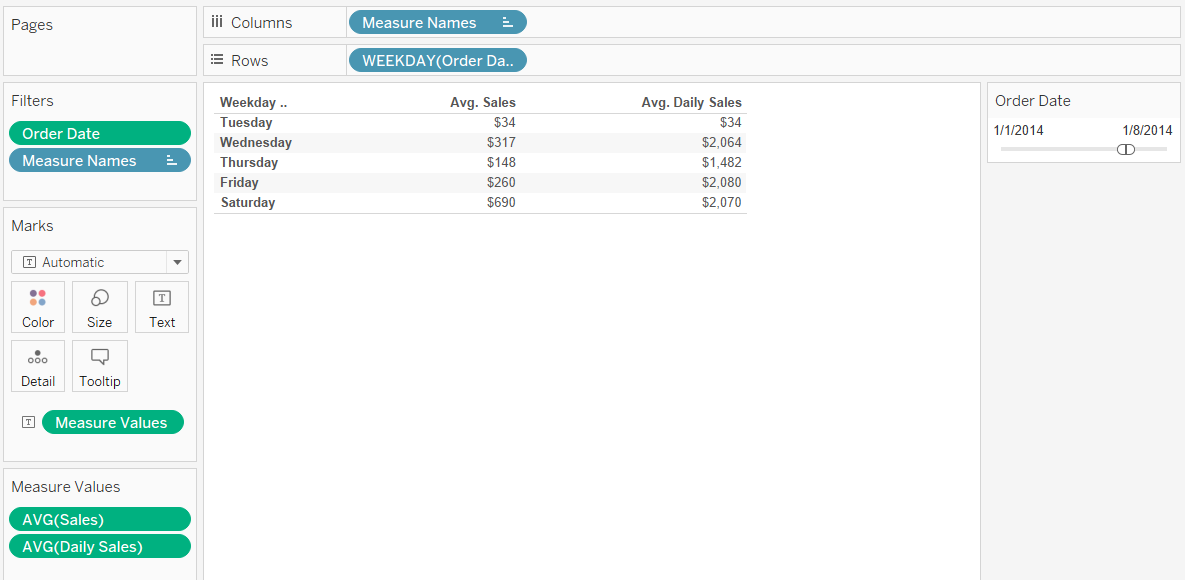
- First, we need to create the daily sales total and then use this as a base to find the average sales for a day or weekdays. Then we can go to the worksheet to add this calculated field into the visualization. Add the filter to make a weekday and change the aggregation to AVG. Now we see the difference between how the Tableau default average values show and how the aggregate AVG value. The first weekday having only one sale occurrence, the next day shows the clear differences which having multiple orders with multiple products in the same sales.
Conclusion
Now in this article, we have learned what is about Tableau functions and its types, Aggregate Function with an example, how to use the aggregate function in Tableau desktop. Happy analysis!
Recommended Articles
This is a guide to Tableau Aggregate Functions. Here we discuss top Aggregate Functions in Tableau, and how to use the Aggregate Functions in Tableau. You can also go through our other related articles to learn more-
- What is Tableau Dashboard?
- Transfer Functions in Matlab
- Aggregate Demand Formula
- Tableau Table Calculation
- Rank Function in Tableau
- Pivot in Tableau
- Tableau Context Filter
- Tableau Bullet Chart
- Examples of Python Built-in Functions
- Introduction to Features and Attributes of Tableau
- Aggregate Functions in PostgreSQL
