Updated June 9, 2023
Introduction to Tableau Count Distinct
Count Distinct is the aggregated function present in Tableau. Distinct stands for the unique value of the dimensions or measures. When we create dimension value for the aggregation, the result of the count distinct is created into measures of the dataset. A calculated field needs to be created for the Count Distinct function. We created a calculated field by clicking the bottom row present near the dimension value set. All the aggregated functions are available with formulas in Tableau. We need to select dimensions as per our choice. We can count Boolean, string, and numbers also. Count (Distinct) returns the unique value in the field.
Syntax of CounD(expression)
CountD([region])
How Does Count Distinct Work in Tableau?
The countD function displays a distinct or unique value of the dimension. It will display the distinct value of the number of items in a group. It will ignore NULL values. Tableau creates a temporary new column in the measure section as a result of the dimension because the result of the count is a number, and the measure contains the quantity of the data. It will count the unique instance of the field. Suppose we have 20,000 records for the ten different countries; then the distinct value of the country will be 10 or 5. It will aggregate distinct values for the record even if a large number of the dataset is present.
Examples of Tableau Count Distinct
Examples of tableau count distinct are given below:
Example #1
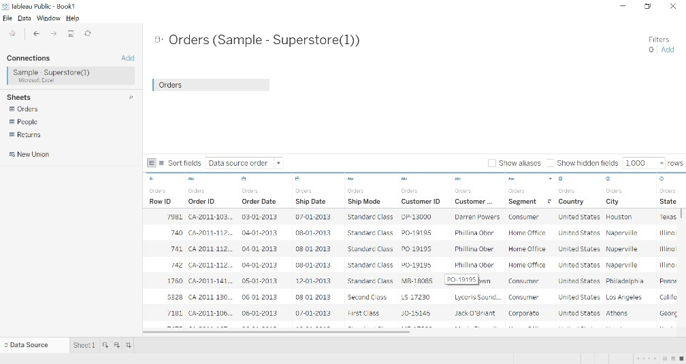
1. We have connected to the sample superstore database in Tableau and fetched the order table.
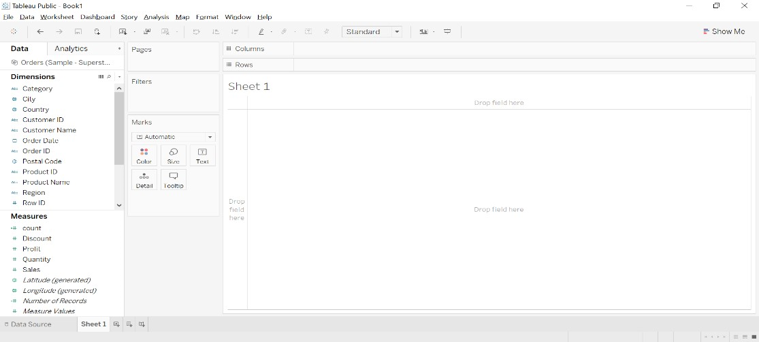
2. Go to sheet1, separating data into measures and dimensions. Dimension is qualitative data, and dimension is quantities data.
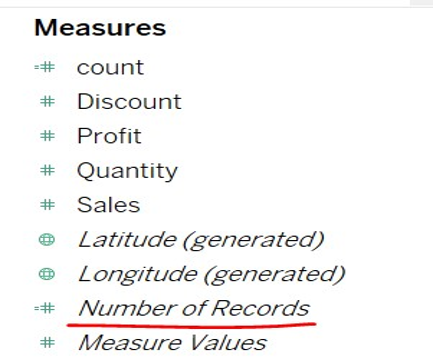
3. The number of records options available in the table, which counts no of the total data available to the data source.
4. Create a calculated field name CountD and enter the formula COUNTD([sub-category]).
5. We can choose any dimension for the COUNTD.
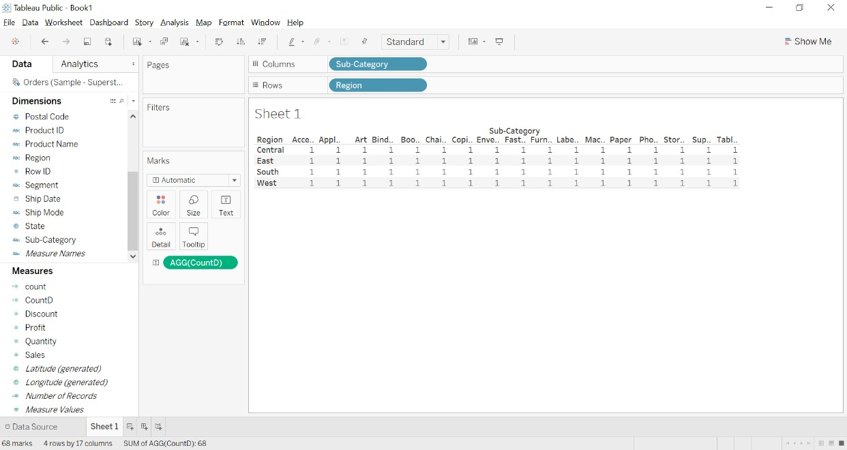
6. Drag sub-categories to columns and regions to Rows.
7. Drag COUNTD calculated field to the text formatting option.
8. We will get the below image.
9. We can observe in the below image distinct count for each sub-category of each region is given as one.
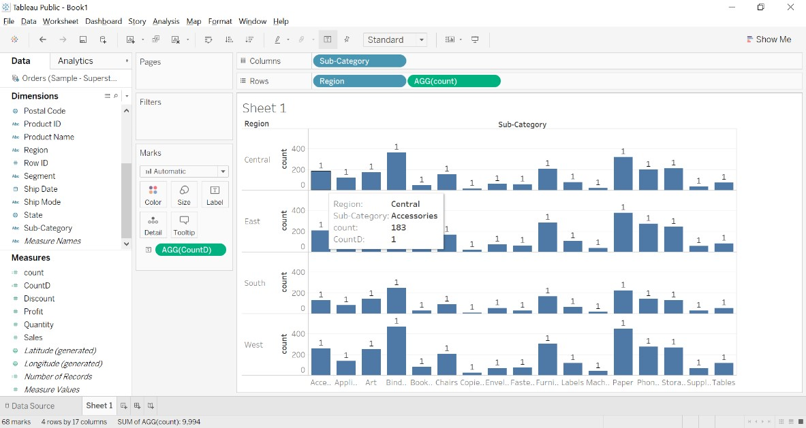
1. We can show you the difference between COUNT and COUNTD.
2. We have created the COUNT([sub-category]) calculated filed and added it to the Rows.
3. We can see in the below image average count for accessories for the central region is 183, and the distinct count is 1 because there are multiple numbers of accessories (items) for the central region, and it is counted as 1.
Example #2
1. Drag the order table to the tableau sheet.
2. Create a Calculated Field CountD(dimension).
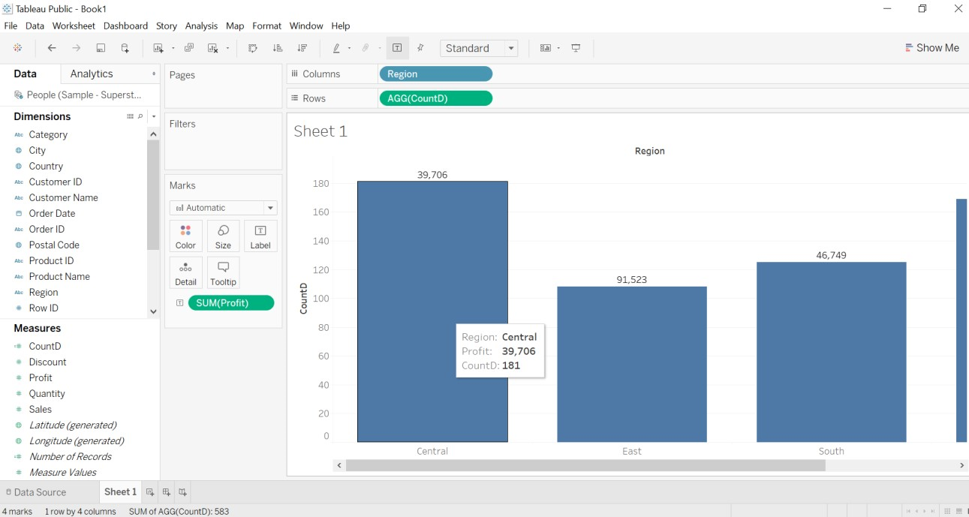
3. Drag region dimension to the column, CountD measure created to rows, and profit measure to Text filtering option.
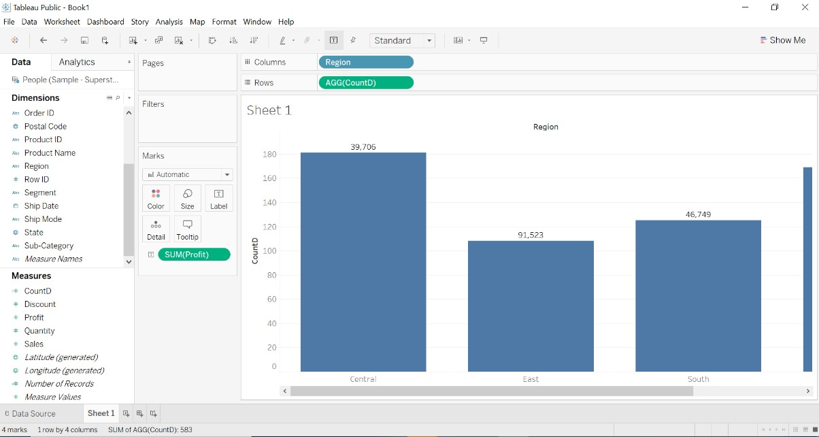
4. As per the calculated field we created for the city, we can observe the result for central region CountD is 181, but the actual count was 2323, and the profit is 39,706.
5. the result for the east region is CountD, a distinct count of 108, and the profit is 91,523.
6. We can observe the distinct count for each region as the unique count for the regions. We had a distinct count for the city as a string.
Example #3
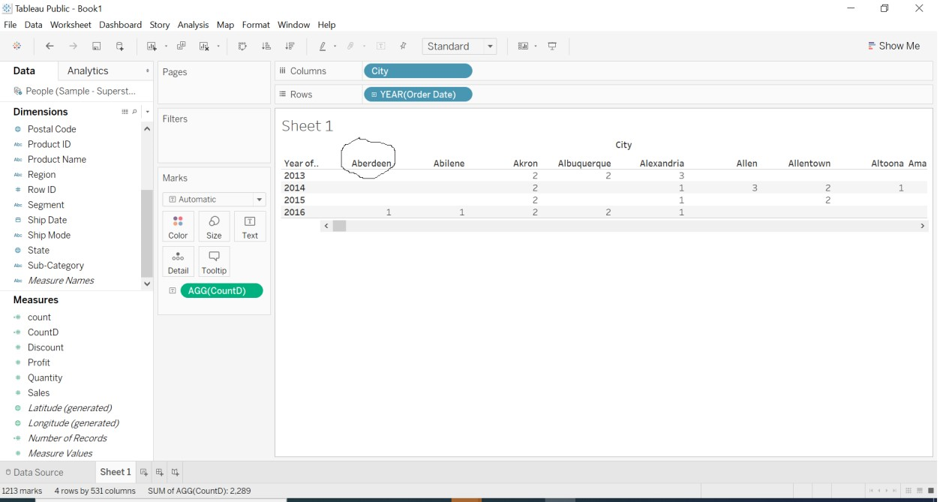
We will countD for the category dimension for the order date of each city.
- Create calculated field CountD(category).
- Drag to columns and order the date to rows.
- Drag CountD to the text formatting option.
We can observe that Aberdeen city for the 2016 year has a distinct count as 1. We have calculated a distinct count for category dimension (category is string value).
Example #4
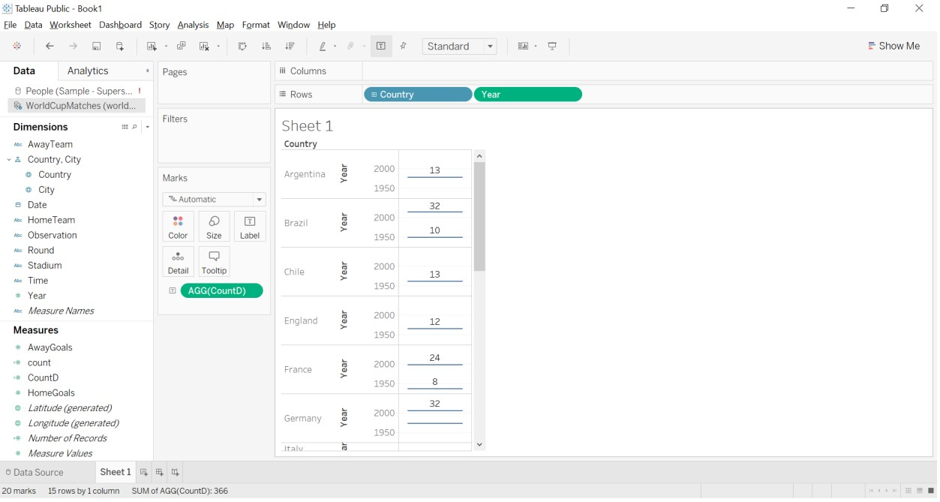
By utilizing a year-based database, we can identify the unique value of the World Cup winning team for each nation.
- We have downloaded the World Cup-matched database file from the Tableau resources website.
- We have created CountD for the HomeTeam (winning team) to count Distinct or unique values for the winning team.
- Drag Country and Year dimensions to rows and CountD to Text formatting option.
- We get the Hometeam to count for a year with the country.
- We get the result for Argentina for 1950 and 2000 as HomeTeam as 13 and 13 is the distinct count for both years; meanwhile, the actual count is 38. For England’s country, the distinct count is 12 for 2000 and 1950 year.
Conclusion
We have learned how to calculate the distinct or unique field or dimension. The key point to remember is calculated field needs to be created first for the CountD aggregation function. The result is always present in measure because it is a number. It is always helpful for the user when they want to find the distinct value of a large dataset.
Recommended Articles
This is a guide to Tableau Count Distinct. Here we discuss How does Count Distinct work in Tableau, along with different examples in detail. You may also look at the following articles to learn more –
