Seaborn Tutorial
Seaborn Basic and Advanced
Seaborn Tutorial
Seaborn tutorial defines an overview of the seaborn library used in python. This library provides a high-level interface to create attractive and informative statistical graphics. The seaborn is a set of examples and instructions that teach the user how to use seaborn. This tutorial is an excellent resource for anyone who wants to learn how to use seaborn for the visualization of data.
Overviews of Seaborn Tutorial
Seaborn tutorial covers multiple topics such as the definition of the seaborn tutorial, overviews of the seaborn tutorial, why we need to learn the seaborn tutorial, seaborn applications, seaborn example, prerequisite, and target audience. Also, his tutorial includes a practical example that will help us to understand how we can use seaborn.
This tutorial provides an accessible and comprehensive introduction to seaborn and its capabilities. This tutorial contains multiple sections. In the definition section we have defined the definition of seaborn. This tutorial is a comprehensive guide that covers the basics of seaborn as well as will contain advanced topics. We have also covered the installation and example of seaborn.
Why do we need to learn Seaborn Tutorial?
Learning the seaborn tutorial is beneficial for multiple reasons. The below point shows why we need to learn the seaborn tutorial as follows.
- Create data visualization: Seaborn makes data visualization while executing a few lines of code. It will contain a default color palette and style to create attractive plots which save lots of time when creating the graphics.
- Statistical Visualizations: Seaborn is designed to create statistical visualization, which makes it a powerful tool for data analysis. It will contain built-in support for multiple estimators such as median, mean, and standard deviation.
- Integrate with pandas: The seaborn is built on top of matplotlib and it will be closely integrated with the panda’s library that is used in data science. It will make it easy to create data visualizations.
- Multi-plot grids: Seaborn provides multiple tools to create multi-plot grids, which display multiple visualizations in one figure. This is useful when we are comparing different types of aspects of our data.
- Customization: Seaborn provides a wide range of customization options, like changing the color palette, adjusting the plot size, and adding animations. This customization allows us to create a visualization of our data.
Seaborn helps us to create informative visualizations that add the data analysis and it will help us to communicate with our data insights.
Applications
Seaborn is the data visualization library used in python that is built for data visualizations. Below are the applications of seaborn as follows.
- Exploratory analysis of data: Seaborn provides the tools to easily analyze and explore the datasets. It offers multiple statistical plots such as histograms, scatter plots, box plots, violin plots, heat maps, and many more. Those plots are helpful to understand data structure.
- Regression analysis: Seaborn provides multiple regression plots such as logistic regression, linear regression, and lowess regression. These plots are useful to understand the relationship between variables and build predictive models.
- Categorical data analysis: Seaborn offers a range of tools to visualize categorical data. It provides point plots, bar plots, count plots, and other visualization which help in analyzing the relationship between categorical variables.
- Time series analysis: Seaborn provides the tools to visualize data of time series. It offers line plots, heatmap, and other tools of visualization for analyzing trends.
- Statistical Analysis: Seaborn provides tools for statistical analysis like confidence intervals and hypothesis testing. It also provides the tools to visualize statistical models such as diagnostic plots.
- Multivariate Visualization: Seaborn provides tools to visualize the relationship between multiple variables. It provides pair plots and other visualization tools which help to analyze the relationship between various variables.
- Natural language processing: Seaborn is used in natural language processing problems, such as text classification and sentiment analysis.
- Classification: We use seaborn for classification problems, such as recognizing images and predicting customer data.
Example
The below example shows seaborn building the machine learning model. To use the seaborn we need to install it using the pip command. The below example shows the installation of seaborn as follows.
python -m pip install seaborn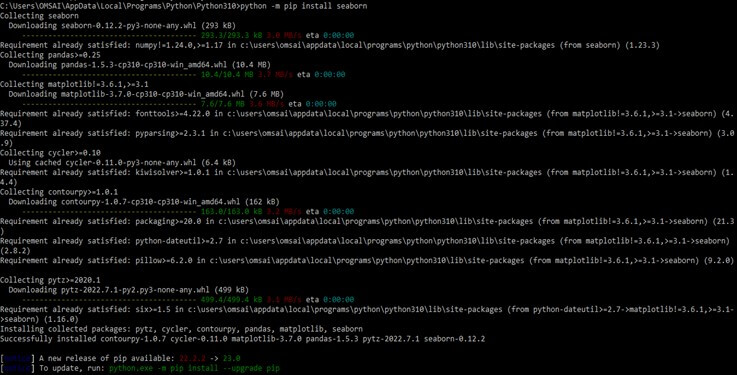
To use the seaborn in our code we need to import it first. The below example shows how we can import the seaborn model as follows.
import seaborn as sns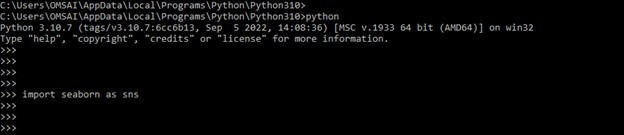
In the below example, we are using the seaborn and matplotlib libraries together. To use both we need to invoke the function of seaborn plotting.
Code:
import seaborn as s
import matplotlib.pyplot as p
d = s.load_dataset("iris")
s.lineplot(x = "sepal_length", y = "sepal_width", data = d)
p.title('Seaborn example')
p.show()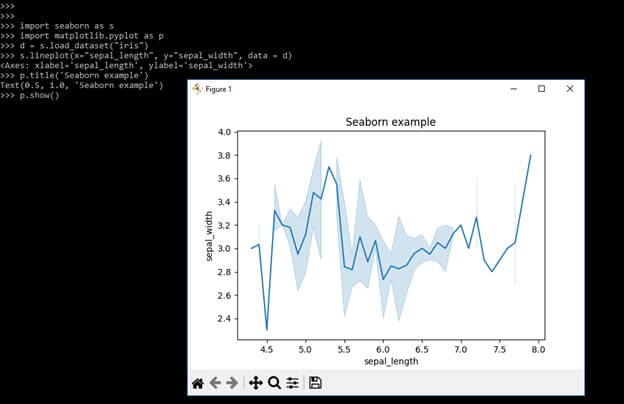
In the below example, we are setting the xlim. We are plotting the line plot using seaborn as follows.
Code:
import seaborn as s
import matplotlib.pyplot as p
d = s.load_dataset("iris")
s.lineplot(x = "sepal_length", y = "sepal_width", data = d)
p.xlim(5)
p.show()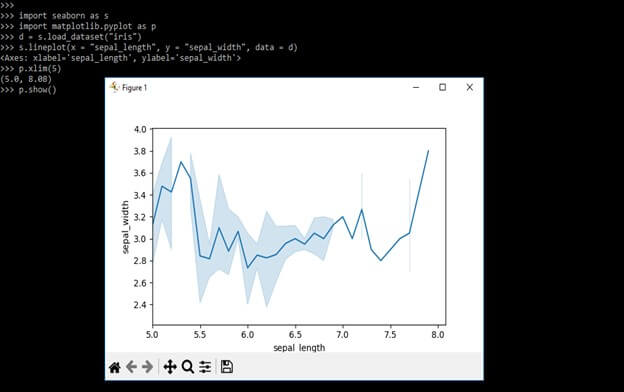
In the below example, we are setting the ylim. We are plotting the line plot using seaborn as follows.
Code:
import seaborn as s
import matplotlib.pyplot as p
d = s.load_dataset("iris")
s.lineplot (x = "sepal_length", y = "sepal_width", data = d)
p.ylim(5)
p.show()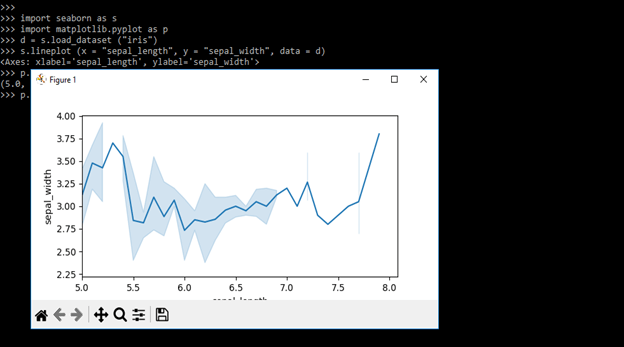
We can customize the seaborn plots, seaborn comes with customized themes and a high-level interface. The below example shows customize the seaborn plots as follows.
Code:
import seaborn as s
import matplotlib.pyplot as p
d = s.load_dataset("iris")
s.lineplot(x = "sepal_length", y = "sepal_width", data = d)
s.set_style("dark")
p.show()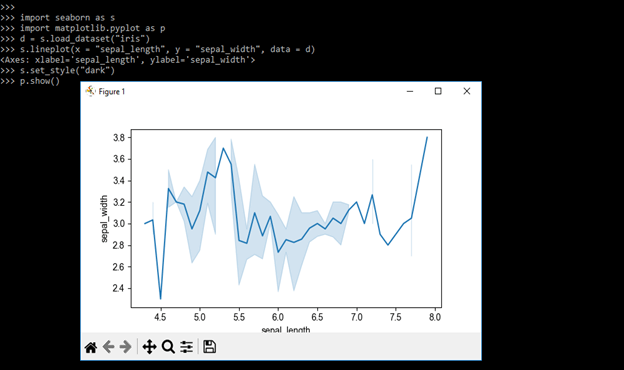
Pre-requisites
Before starting with the seaborn tutorial we required a basic understanding of the following topics as follows:
- Python: We required a basic understanding of python programming language. We need a good understanding of python.
- Numpy: This is a python library for scientific computing that provides support for matrices and arrays. Seaborn relies on the numpy arrays.
- Pandas: This is a python library that provides powerful data for analysis and manipulation. It is used to load and clean the data before feeding it into the ML model. We are familiar with the panda’s library to work with seaborn.
- Matplotlib: Matplotlib is a python library that is used for data visualization. It will provide a wide range of functions for plotting to create different types of plots. We are familiar with matplotlib to work with seaborn.
- Statistics: Seaborn is used in data visualization, so understanding statistics will help us to interpret the plots.
Target Audience
The target audience of the seaborn tutorial is vary depends on per level. The target audience of seaborn is primarily statisticians, data scientists, and analysts which use python for data visualization and analysis. Seaborn provides a high-level interface to create attractive and informative graphics which makes it the ideal tool for professionals. Seaborn is used for data analysis, where the goal is to understand the structure of data.
Seaborn is widely used by professionals who work in social science, healthcare, finance, and marketing where visualization and data analysis is essential for decision-making. Seaborn is a very popular and powerful tool that required anyone who needs to visualize and analyze the data. It is also useful for attractive visualizations to make the ideal choice for advanced users and beginners.
Conclusion
The seaborn tutorial provides an accessible and comprehensive introduction to seaborn and its capabilities. This tutorial contains multiple sections. In the definition section we have defined the definition of seaborn. The seaborn library provides a high-level interface to create attractive and informative statistical graphics. This tutorial is an excellent resource for anyone who wants to learn how to use seaborn for the visualization of data.
Valuation, Hadoop, Excel, Web Development & many more.