Updated March 15, 2023

Introduction to Seaborn Heatmap Size
Seaborn heatmap size is used to produce the matrix graphical representation. It will plot the matrix onto the graph and also use the shaded of different colors for different types of values. We are using the seaborn heatmap function for creating the plot of heatmap into the module of seaborn. At the time of representing the large matrix, the plot default size is not providing a clear representation of the data.
Key Takeaways
- In python, we are using the seaborn heatmap function for creating a heatmap plot into the module of seaborn. Basically, the heatmap is used to represent the matrix.
- In it set function is used to establish the theme and configuration of the seaborn plots in python.
What is Seaborn Heatmap Size?
Seaborn heatmap function is returning the axes object of the matplotlib. The seaborn heatmap uses the color palette for depicting the variation of linked data. In a seaborn module, we use the method of the seaborn heatmap for making the chart of the heatmap.
Below is the syntax of the seaborn heatmap as follows:
Syntax:
seaborn.heatmap (parameters)Annotation is the line text which appears on the heatmap cell for describing the representation of a particular cell. The annotation font size will be set by default, we can alter the same by using the kws parameter of the heatmap method. The kws is the dictionary-type option that requires the size key value. The annotation size is determined by using the assigned key value. The multiple conditions are followed by raising the size of annotations like the function of the heatmap. The colorbar is the color scale which was rectangular and was used to interpret the data of the heatmap.
By default, it is the same size as the heatmap but also we can change the size of the heatmap by using the heatmap function. The seaborn heatmap is an axes level function and it will draw into the axes which were provided by the ax argument.
How to Set Seaborn Heatmap Size?
The set function is used to set the seaborn heatmap size. The set function will be defining the theme configuration of the seaborn plots. We are mentioning the size of the plot by using rc parameter.
The below example shows the use of the set method to set the size:
Code:
import pandas as pd
import matplotlib.pyplot as plt
import seaborn as sns
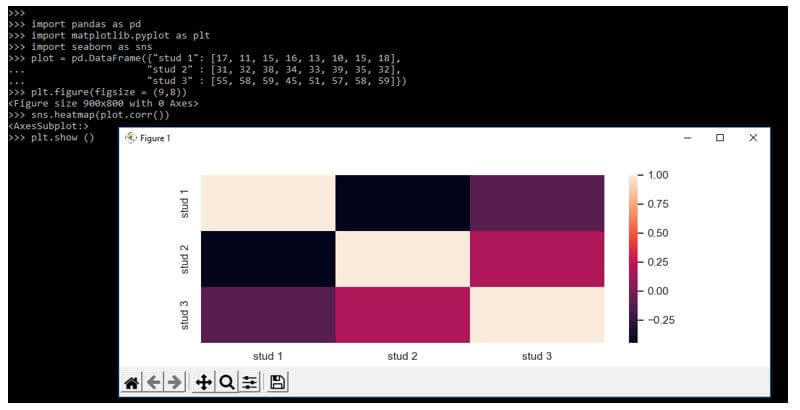
plot = pd.DataFrame({"stud 1": [ ],
"stud 2" : [ ],
"stud 3" : [ ]})
sns.set (rc = {'figure.figsize':(9, 8)})
sns.heatmap(plot.corr())
plt.show ()Output:

In the below example, we are using the figure function for setting it. The heatmap will be plotted by using the figure as follows.
Code:
import pandas as pd
import matplotlib.pyplot as plt
import seaborn as sns
plot = pd.DataFrame({"stud 1": [ ],
  "stud 2" : [ ],
  "stud 3" : [ ]})
plt.figure(figsize = (9,8))
sns.heatmap(plot.corr())
plt.show ()
Output:
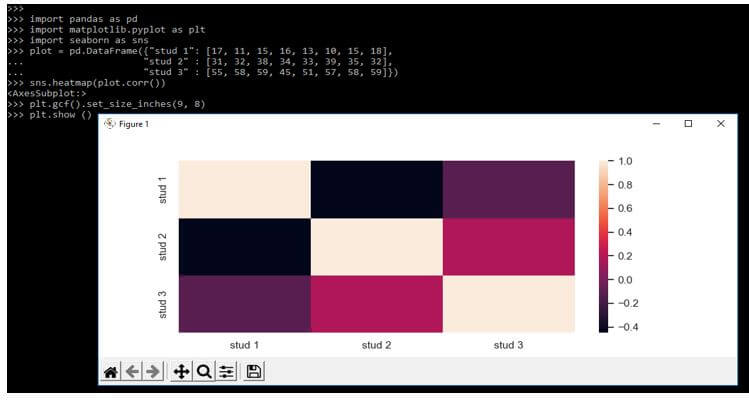
In the below example, we are using gcf function to set the heatmap size. In the below example, we are importing the pandas, matplotlib, and seaborn library as follows.
Code:
import pandas as pd
import matplotlib.pyplot as plt
import seaborn as sns
plot = pd.DataFrame({"stud 1": [ ],
  "stud 2" : [ ],
  "stud 3" : [ ]})
sns.heatmap (plot.corr())
plt.gcf().set_size_inches(9, 8)
plt.show ()
Output:
How to Adjust Seaborn Heatmap Size?
We can use the argument of figsize for specifying the size of the seaborn heatmap. In the below example, we are adjusting it. We are loading the flight dataset as follows.
Code:
import matplotlib.pyplot as plt
import seaborn as sns
import pandas as pd
plot = sns.load_dataset ("flights")
plot = plot.pivot("month", "year")
fig, ax = plt.subplots( )
sns.heatmap(plot, linewidths = .3)
plt.show ()
Output:
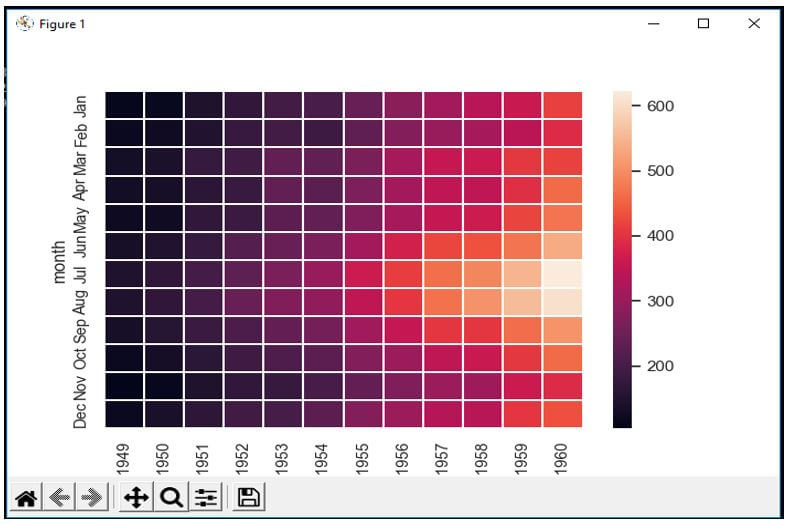
In the above example, we can see that the heatmap contains the same of height and width. In the below example, we are making the heatmap narrow by making the first argument of figsize smaller as follows.
Code:
import matplotlib.pyplot as plt
import seaborn as sns
import pandas as pd
plot = sns.load_dataset ("flights")
plot = plot.pivot("month", "year")
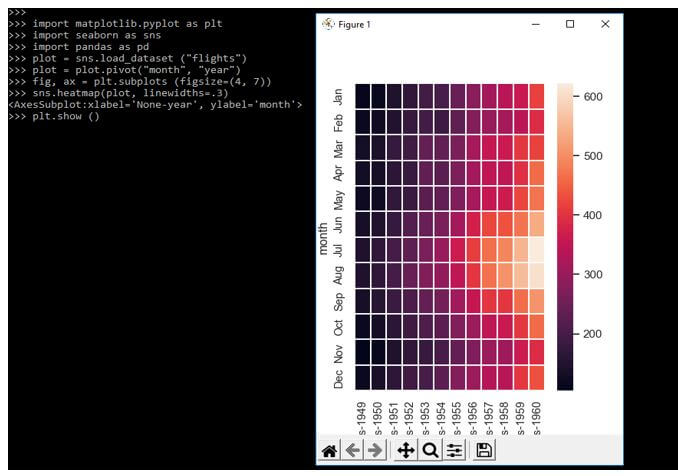
fig, ax = plt.subplots (figsize=(4, 7))
sns.heatmap (plot, linewidths=.3)
plt.show ()Output:
In the below example, we are making the heatmap more wide by making the heatmap figsize as smaller as follows.
Code:
import matplotlib.pyplot as plt
import seaborn as sns
import pandas as pd
plot = sns.load_dataset ("flights")
plot = plot.pivot("month", "year")
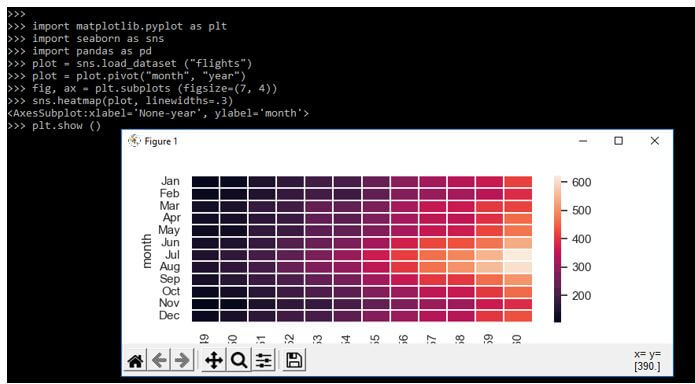
fig, ax = plt.subplots (figsize=(7, 4))
sns.heatmap(plot, linewidths=.3)
plt.show ()Output:
Examples
Given below are the examples mentioned:
Example #1
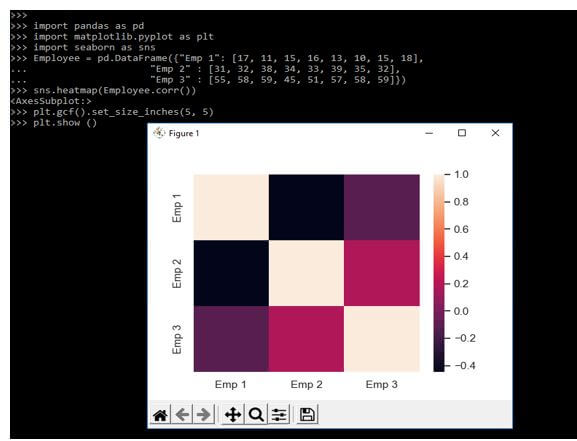
In the below example, we are defining the employee data as follows.
Code:
import pandas as pd
import matplotlib.pyplot as plt
import seaborn as sns
Employee = pd.DataFrame({"Emp 1": [ ],
  "Emp 2" : [ ],
  "Emp 3" : [ ]})
sns.heatmap (Employee.corr())
plt.gcf().set_size_inches(5, 5)
plt.show ()
Output:
Example #2
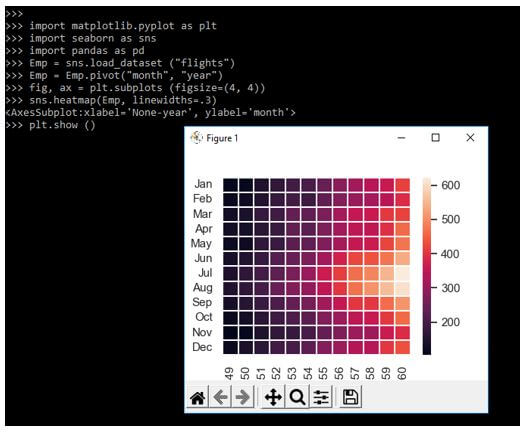
In the below example, we are loading the dataset name as flights as follows.
Code:
import matplotlib.pyplot as plt
import seaborn as sns
import pandas as pd
Emp = sns.load_dataset ("flights")
Emp = Emp.pivot ("month", "year")
fig, ax = plt.subplots (figsize=(4, 4))
sns.heatmap(Emp, linewidths=.3)
plt.show ()
Output:
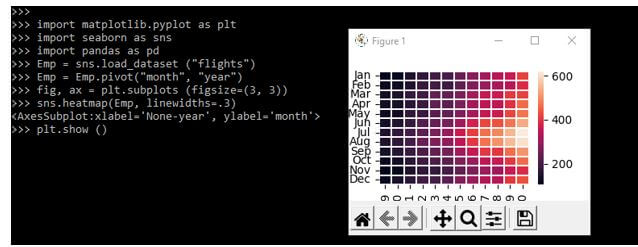
Example #3
In the below example, we are setting the figsize as 3 and 3. We are importing the matplotlib and seaborn libraries as follows.
Code:
import matplotlib.pyplot as plt
import seaborn as sns
import pandas as pd
Emp = sns.load_dataset ("flights")
Emp = Emp.pivot("month", "year")
fig, ax = plt.subplots (figsize=(3, 3))
sns.heatmap(Emp, linewidths=.3)
plt.show ()
Output:
FAQ
Given below are the FAQs mentioned:
Q1. What is the use of seaborn heatmap size in python?
Answer:
It is used to define the size of the plot. It will represent the matrix graphical representation.
Q2. Which libraries do we need to use while defining seaborn heatmap size in python?
Answer:
We need to use the pandas, seaborn, numpy, and matplotlib library at the time of using it.
Q3. Which function we are using at the time of setting the size of seaborn heatmap?
Answer:
We are using set, figure, and gcf function at the time of setting the size of seaborn heatmap function in python.
Conclusion
Seaborn heatmap function is returning axes object of matplotlib. Seaborn heatmap uses the color palette for depicting the variation of linked data. It is used to produce the matrix graphical representation. We are using the seaborn heatmap function for creating plot of heatmap into the module of seaborn.
Recommended Articles
This is a guide to Seaborn Heatmap Size. Here we discuss the introduction, how to set and adjust seaborn heatmap size. examples and FAQ. You may also have a look at the following articles to learn more –
