Updated March 15, 2023

Introduction to Seaborn Figure Size
Seaborn figure size is changed by using two methods; we can change the size of the figure in seaborn by using two ways. The first method is used to change the axes level size of the plots, such as seaborn boxplot and seaborn scatterplot. We can use the second method to adjust the size at figure levels like seaborn implot, seaborn catplot, and seaborn jointplot. It is very important.
Key Takeaways
- In it, we are defining the data by using the data frame method. The panda’s library will contain this type of function.
- We can also take the different random values and assign the same to the variable which we define in our code.
Overview
The matplotlib pyplot and subplots are used to create a figure and set the subplots. It contains the parameter called figsize, which takes the tuple as an argument that includes the plot’s width and height; it will also return the figure and axes of the array. When calling the seaborn plot, we need to set the ax parameter equal as per the array’s axes, returning the subplots while setting the dimension of the plot.
The set function of the seaborn is used for controlling the configuration and theme of the seaborn plot. The set function RC parameter is used to manage the size of the figure. We are passing the value of the dictionary to the parameter by using the key as figsize and the dimensions required. Setting the size of the figure is very straightforward. It will show and manages the seaborn and matplotlib.
It is the module that enables the users to create quantitative visuals. We are using the subplot method for changing the graphics dimensions. For setting the plot extent, we are using various methods. The subplots method generates different types of subplots. It will contain the figsize argument, which requires a string element that indicates the length and width. It will revert visual as well as the collection of axes.
How to Create Seaborn Figure Size?
When calling the seaborn plot, we will set the ax parameter. The plot and customization style is maintained using the set method of the seaborn module.
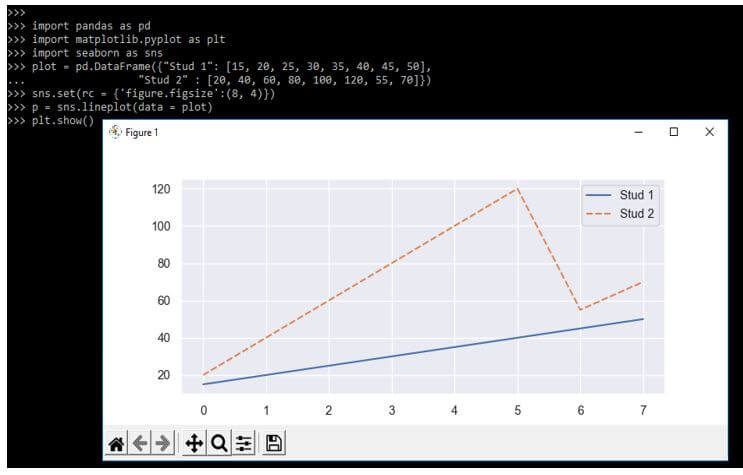
The below example shows to create by using the set method of the seaborn library for modifying the plot dimensions.
Code:
import pandas as pd
import matplotlib.pyplot as plt
import seaborn as sns
plot = pd.DataFrame({"Stud 1": [ ],
  "Stud 2" : [ ]})
sns.set(rc = {'figure.figsize':(8, 4)})
p = sns.lineplot(data = plot)
plt.show()
Output:
The function of RC params into the matplotlib is identical in a set method of the seaborn package that will determine the graph. For adjusting the dimensions we are utilizing the figsize argument as follows.
Code:
import pandas as pd
import matplotlib.pyplot as plt
import seaborn as sns
from matplotlib import rcParams
plot = pd.DataFrame({"Stud 1": [ ],
  "Stud 2" : [ ]})
rcParams['figure.figsize'] = 8, 4
p = sns.lineplot(data = plot)
plt.show()
Output:

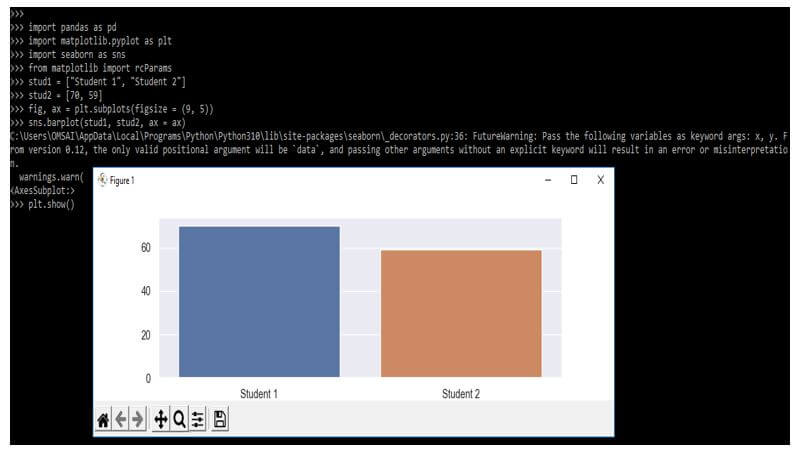
For displaying the illustration we are using the figure method. We are utilizing the argument of figsize for defining the graphic dimension as follows.
Code:
import pandas as pd
import matplotlib.pyplot as plt
import seaborn as sns
from matplotlib import rcParams
stud1 = ["Student 1", "Student 2"]
stud2 = [70, 59]
fig, ax = plt.subplots(figsize = (9, 5))
sns.barplot (stud1, stud2, ax = ax)
plt.show()
Output:
How to Set Seaborn Figure Chat Size Code?
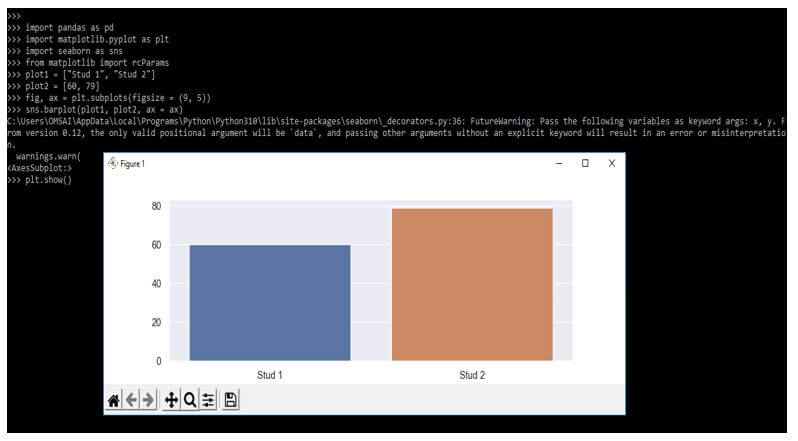
Basically, python is the library of data visualization. In the below example we are considering the two student for plotting the bar plot as follows.
Code:
import pandas as pd
import matplotlib.pyplot as plt
import seaborn as sns
from matplotlib import rcParams
plot1 = ["Stud 1", "Stud 2"]
plot2 = [60, 79]
fig, ax = plt.subplots(figsize = (9, 5))
sns.barplot (plot1, plot2, ax = ax)
plt.show()
Output:
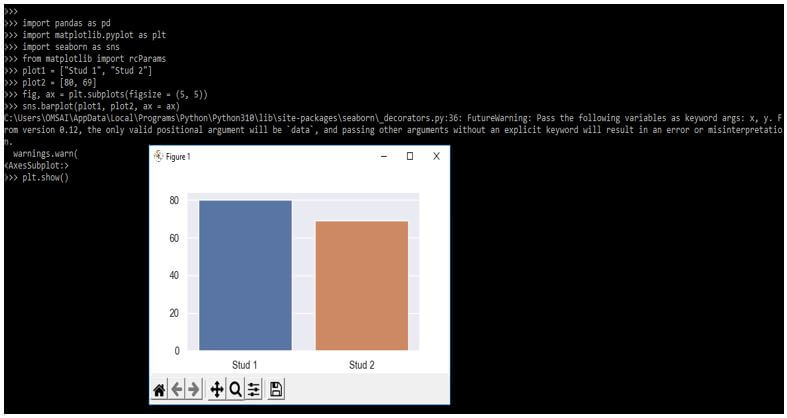
In the below example, we are setting the seaborn figure chat size as 5 and 5 as follows. We are defining stud1 and stud2 as follows.
Code:
import pandas as pd
import matplotlib.pyplot as plt
import seaborn as sns
from matplotlib import rcParams
plot1 = ["Stud 1", "Stud 2"]
plot2 = [80, 69]
fig, ax = plt.subplots(figsize = (5, 5))
sns.barplot (plot1, plot2, ax = ax)
plt.show ()
Output:
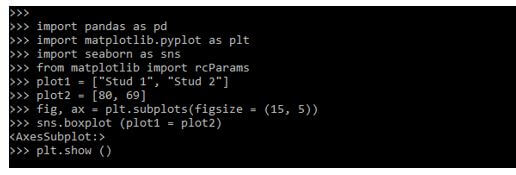
We can also set the size of the figure by using boxplot. In the below example, we are creating the boxplot for setting the chart size as follows.
Code:
import pandas as pd
import matplotlib.pyplot as plt
import seaborn as sns
from matplotlib import rcParams
plot1 = ["Stud 1", "Stud 2"]
plot2 = [80, 69]
fig, ax = plt.subplots(figsize = (15, 5))
sns.boxplot (plot1 = plot2)
plt.show ()
Output:
Examples of Seaborn Figure Size
Given below are the examples mentioned:
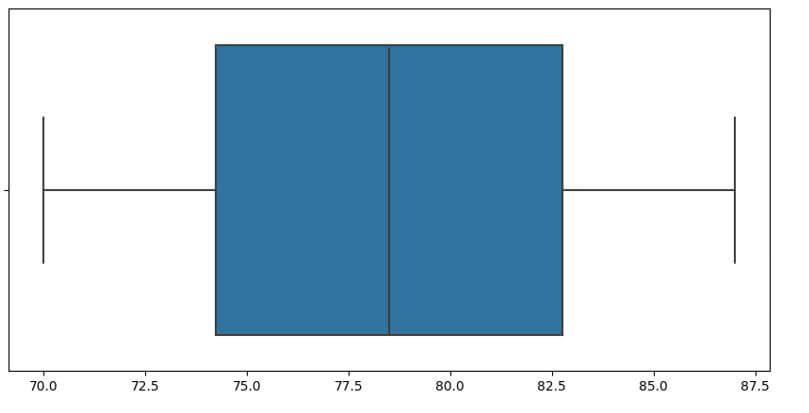
Example #1
In the below example, we are defining the two employees.
Code:
import pandas as pd
import matplotlib.pyplot as plt
import seaborn as sns
from matplotlib import rcParams
plot1 = ["Emp 1", "Emp 2"]
plot2 = [70, 87]
fig, ax = plt.subplots(figsize=(40, 5))
sns.barplot (plot1, plot2, ax = ax)
plt.show()
Output:
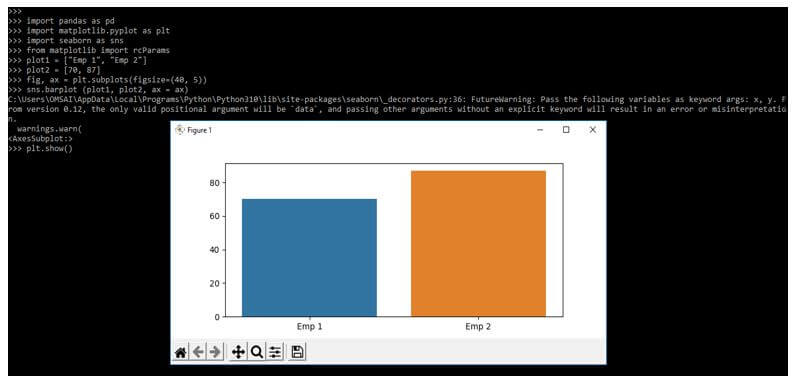
Example #2
In the below example, we are drawing the plot size as 7 and 7. We are using the barplot to define as follows.
Code:
import pandas as pd
import matplotlib.pyplot as plt
import seaborn as sns
from matplotlib import rcParams
plot1 = ["Emp 1", "Emp 2"]
plot2 = [70, 87]
fig, ax = plt.subplots(figsize=(7, 7))
sns.barplot (plot1, plot2, ax = ax)
plt.show()
Output:
FAQs
Given below are the FAQ mentioned:
Q1. What is the use of seaborn figure size in python?
Answer:
We are creating the figure and also setting the subplots, it contains the parameter by using the same we are setting the size of the figure.
Q2. Which libraries we are using at the time of developing code by using it?
Answer:
We need to use the numpy, pandas, matplotlib, and seaborn library for using it.
Q3. Which methods we are using with seaborn figure size?
Answer:
We are using scatterplot, boxplot, catplot and jointplot method with it.
Conclusion
We can use the second method to change the size at the figure level like seaborn implot, seaborn catplot, and seaborn jointplot. It is very important. We are passing the value of the dictionary to the parameter by using the key as figsize and the dimensions which were required.
Recommended Articles
This is a guide to Seaborn Figure Size. Here we discuss the introduction, and how to create seaborn figure size? examples and FAQ respectively. You may also have a look at the following articles to learn more –
