Updated March 15, 2023

Introduction to Seaborn Legend
Seaborn legend is a dialog box located in the graph and includes the different attribute descriptions with the graph of respected colors. Seaborn library in python is making graphics on top of matplotlib with the data structures of pandas. We can change the properties by including the background, location size, color, and other properties. It is very important and useful in python.
Key Takeaways
- The legend is a little box displayed on the edge of a chart; also, it will be used to summarize the parts of a graph.
- Suppose our chart contains a data set; it will identify which element denotes the value type.
What is Seaborn Legend?
It is a small box; usually, it will appear in the corner of our graph and is used to tell us about the elements of the specified plot. Suppose the graph contains multiple data; it will tell us which component represents the data type. We can specify the position and size of the legend box by using the bbox_to_anchor and loc parameters. The loc parameter is used for specifying the legend location; different types of the number will determine the different types of locations.
The value of the location parameter is zero by default. This means we can say that it will search as per the best position for placing the legend where it will contain the minimum overlapping. The bbox_to_anchor parameter in the legend will specify the legend position with respect to that location and will be specified in the parameter of loc. When setting bbox_to_anchor parameter as a tuple of 2 elements, it will consider their values as x and y for positioning the loc.
For changing the position, we are using the below syntax. We use the plt.legend command to change the legend’s work.
Syntax:
Plt.legend (loc = ‘ ’)The default location is best. We can use the below location to change the location of the legend.
- Upper right
- Upper left
- Lower left
- Lower right
- Right
- Center left
- Center right
- Lower center
- Upper center
- Center
How to Add and Change Seaborn Legend?
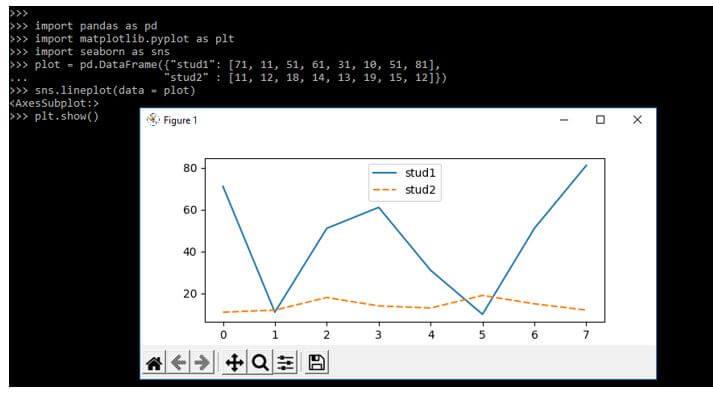
The below example shows that by default legend will add to the graph. In the below example, we can see that by default stud1 and stud2 legend will automatically added.
Code:
import pandas as pd
import matplotlib.pyplot as plt
import seaborn as sns
plot = pd.DataFrame({"stud1": [71, 11, 51, 61, 31, 10, 51, 81],
  "stud2" : [11, 12, 18, 14, 13, 19, 15, 12]})
sns.lineplot(data = plot)
plt.show()
Output:
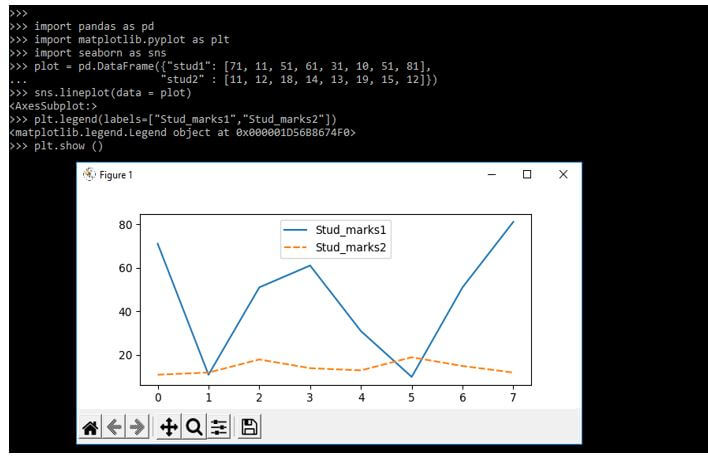
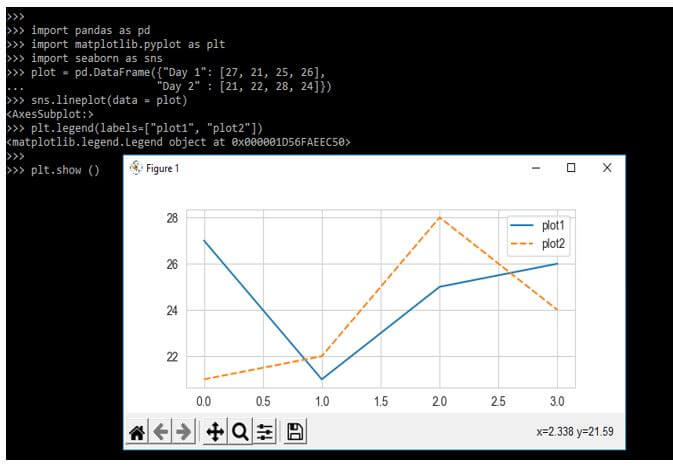
If suppose we have to explicitly add the legend, then we are using the legend function from the library of matplotlib. In the below example, we are adding our own label explicitly as follows.
Code:
import pandas as pd
import matplotlib.pyplot as plt
import seaborn as sns
plot = pd.DataFrame({"stud1": [71, 11, 51, 61, 31, 10, 51, 81],
  "stud2" : [11, 12, 18, 14, 13, 19, 15, 12]})
sns.lineplot(data = plot)
plt.legend(labels=["Stud_marks1","Stud_marks2"])
plt.show ()
Output:
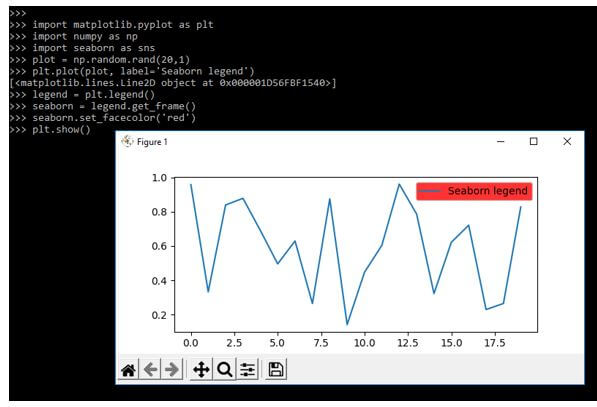
In the below example, we are changing the color of legends. We are using set_facecolor function from the library of matplotlib to pass the name and color as follows.
Code:
import matplotlib.pyplot as plt
import numpy as np
import seaborn as sns
plot = np.random.rand (20,1)
plt.plot (plot, label='Seaborn legend')
legend = plt.legend()
seaborn = legend.get_frame ()
seaborn.set_facecolor ('red')
plt.show()
Output:
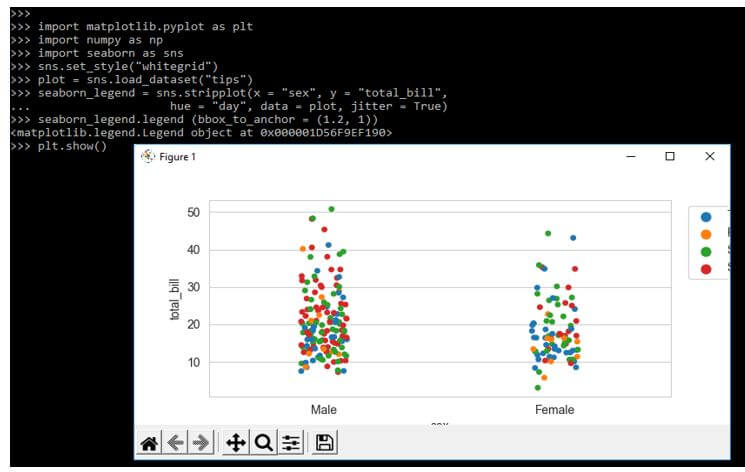
In the below example, we are changing the location of legend. We are using the legend function and passing the bbox_to_anchor for changing the location as follows.
Code:
import matplotlib.pyplot as plt
import numpy as np
import seaborn as sns
sns.set_style("whitegrid")
plot = sns.load_dataset("tips")
seaborn_legend = sns.stripplot(x = "sex", y = "total_bill",
  hue = "day", data = plot, jitter = True)
seaborn_legend.legend (bbox_to_anchor = (1.2, 1))
plt.show()
Output:
Seaborn Legend Move
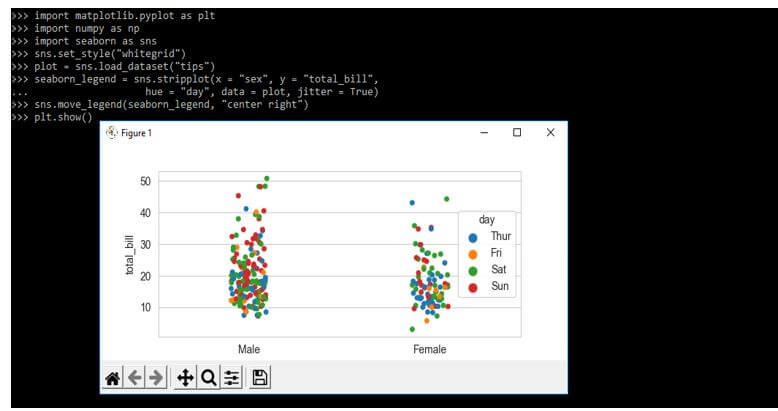
It is not exposing the public control over positional parameters. The below example shows how to move the seaborn legend as follows. We are moving to the center right.
Code:
import matplotlib.pyplot as plt
import numpy as np
import seaborn as sns
sns.set_style("whitegrid")
plot = sns.load_dataset("tips")
seaborn_legend = sns.stripplot(x = "sex", y = "total_bill",
  hue = "day", data = plot, jitter = True)
sns.move_legend (seaborn_legend, "center right")
plt.show ()
Output:
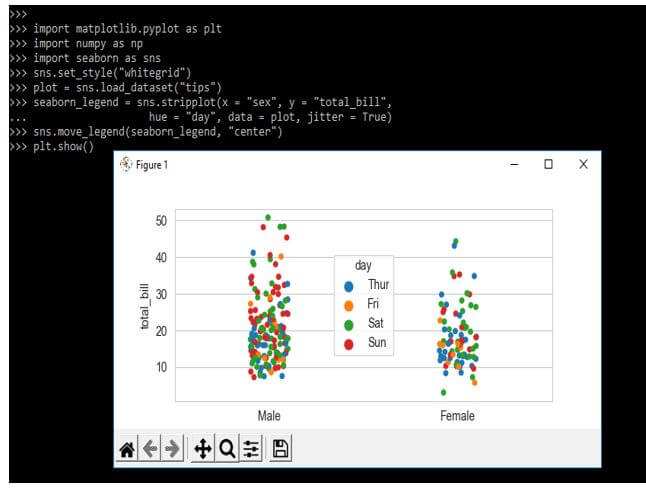
To move we are using the move_legend function. In the below example we are moving the seaborn legend into the center position as follows.
Code:
import matplotlib.pyplot as plt
import numpy as np
import seaborn as sns
sns.set_style ("whitegrid")
plot = sns.load_dataset ("tips")
seaborn_legend = sns.stripplot (x = "sex", y = "total_bill",
  hue = "day", data = plot, jitter = True)
sns.move_legend (seaborn_legend, "center")
plt.show ()
Output:
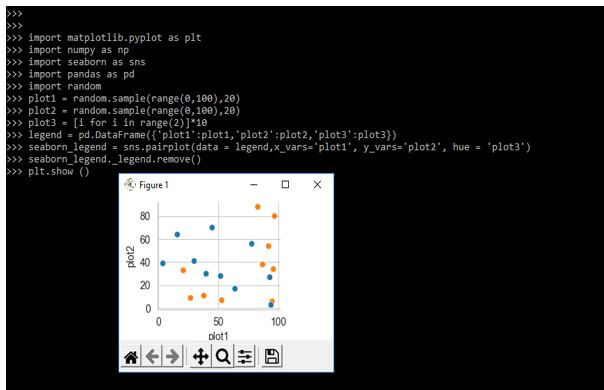
Seaborn Legend Remove
We are using the remove function to remove seaborn legend from the graph. This method will begin with different types of pair grid class from the module of seaborn.
Code:
import matplotlib.pyplot as plt
import numpy as np
import seaborn as sns
import pandas as pd
import random
plot1 = random.sample (range(0,100),20)
plot2 = random.sample (range(0,100),20)
plot3 = [i for i in range (2)]*10
legend = pd.DataFrame ({'plot1':plot1, 'plot2':plot2, 'plot3':plot3})
seaborn_legend = sns.pairplot (data = legend,x_vars = 'plot1', y_vars = 'plot2', hue = 'plot3')
seaborn_legend._legend.remove()
Output:
Examples of Seaborn Legend
Given below are the examples mentioned:
Example #1
Here we are adding the legend as follows.
Code:
import pandas as pd
import matplotlib.pyplot as plt
import seaborn as sns
plot = pd.DataFrame()
sns.lineplot(data = plot)
plt.legend(labels=["plot1", "plot2"])
Output:
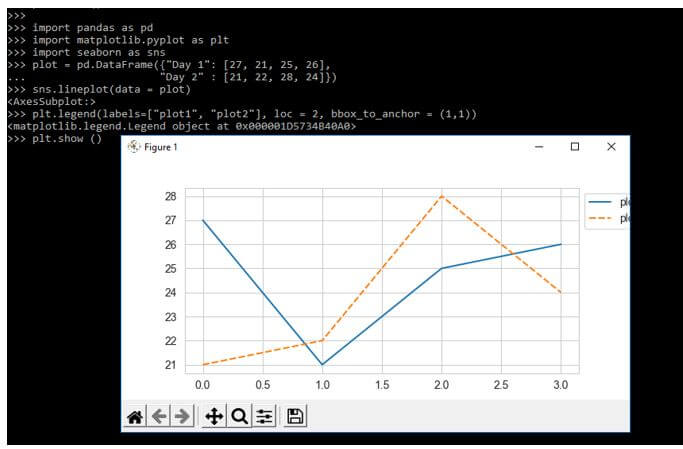
Example #2
We are using the loc and bbox_to_anchor parameters.
Code:
import pandas as pd
import matplotlib.pyplot as plt
import seaborn as sns
plot = pd.DataFrame()
sns.lineplot(data = plot)
plt.legend(labels=["plot1", "plot2"], loc = 2, bbox_to_anchor = (1,1))
plt.show()
Output:
Frequently Asked Questions
Given below are the FAQs mentioned:
Q1. What is the use of seaborn legend in python?
Answer:
By using legend we can easily change the properties of graph like legend location, size, colors, and other properties.
Q2. Which libraries we need while using seaborn legend in python?
Answer:
We are using the seaborn, matplotlib, pandas, and numpy library while using seaborn legend in python.
Q3. Which method we are using at the time of removing seaborn legend?
Answer:
We are using the remove method or function to remove the seaborn legend from our graph in python.
Conclusion
The loc parameter is used for specifying the legend location, different types of numbers will specify that different types of locations. It is a dialog box that is located in the graph and which includes the different attribute descriptions with the graph of respected colors.
Recommended Articles
This is a guide to Seaborn Legend. Here we discuss the introduction, and how to add and change seaborn legend? examples and FAQs. You may also have a look at the following articles to learn more –
