Updated March 17, 2023
Introduction to Seaborn Implot
Seaborn Implot is a method used to draw the plot of scattering on the facet grid, regression model, and the facet data if fitting across the facet grid. It will combine the facet grid and regplot; this function will be intended as an interface convenient for the regression model across subsets of conditional datasets. Seaborn scatterplot is very useful in python to draw scatter plots.

Key Takeaways
- The seaborn implot is the basic plot; it will show the line in a two-dimensional plane. We can plot the same by using the seaborn or matplotlib library.
- When using seaborn with implot, it will, by default, include the data sets of the plot.
What is Seaborn lmplot?
The facet grid visualizes relationships with other subsets and data distribution. The facet grid is also used to create grids from multiple plots. It works on rows that provide axes and hues. It is beneficial when we are working on a complicated data set. We can customize the final figure with the help of the seaborn implot by using different parameters. We can also supply the customizations like plot color as a key-value pair of a dictionary. There are multiple options available to estimate the model of regression.
How to Add Seabo0rn lmplot?
For adding the seaborn implot, we need to follow the below steps. We also need to set the figure size while adding it.
- In the first step, we need to set the figure size and add the padding between subplots.
- After setting the figure size and adding subplots in the second step, we make the pandas data frame by using two columns for the x and y-axis.
- After making the data frame of pandas in this step, we use the implot method.
- After using the implot method in this step, we get the current axis by utilizing the gca method.
- After using the gca method, now, in this step, we are using the show method to display the graph.
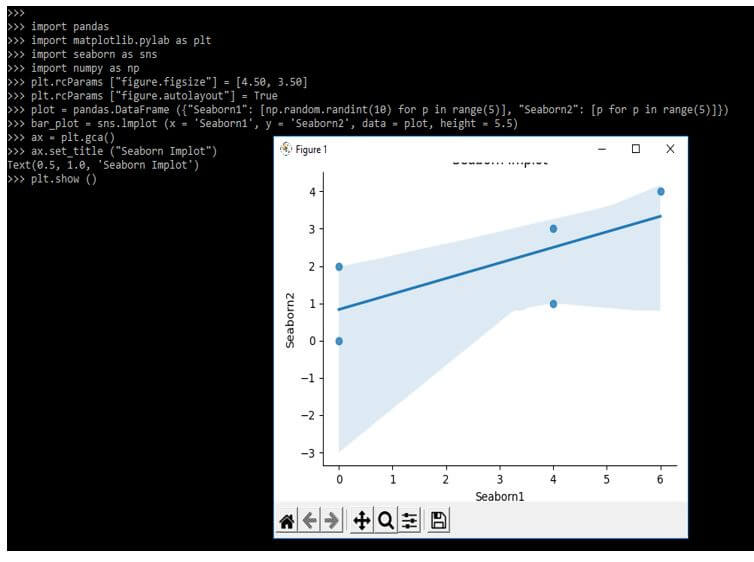
The below example shows how we can add the seaborn implot as follows. In the below example, we are importing the numpy, pandas, seaborn, and matplotlib library. Also, we are using the random function to display the random records. We are also defining the figsize method to define the size of the graph.
Code:
import pandas
import matplotlib.pylab as plt
import seaborn as sns
import numpy as np
plt.rcParams ["figure.figsize"] = [4.50, 3.50]
plt.rcParams ["figure.autolayout"] = True
plot = pandas.DataFrame ({"Seaborn1": [np.random.randint (10) for p in range(5)], "Seaborn2": [p for p in range(5)]})
bar_plot = sns.lmplot (x = 'Seaborn1', y = 'Seaborn2', data = plot, height = 5.5)
ax = plt.gca ()
ax.set_title ("Seaborn Implot")
plt.show ()
Output:
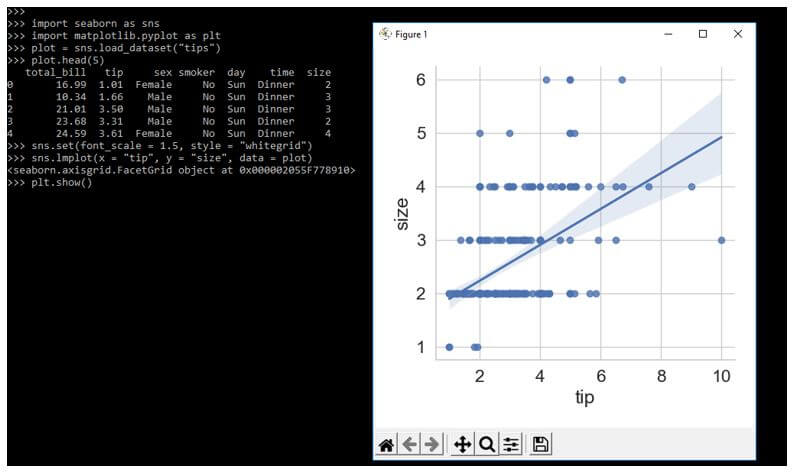
In the below example, we are adding the implot by loading the data set as follows. We are adding the tips data set as follows.
Code:
import seaborn as sns
import matplotlib.pyplot as plt
plot = sns.load_dataset("tips")
plot.head(5)
sns.set(font_scale = 1.5, style = "whitegrid")
sns.lmplot()
plt.show()
Output:
Seaborn lmplot() Method
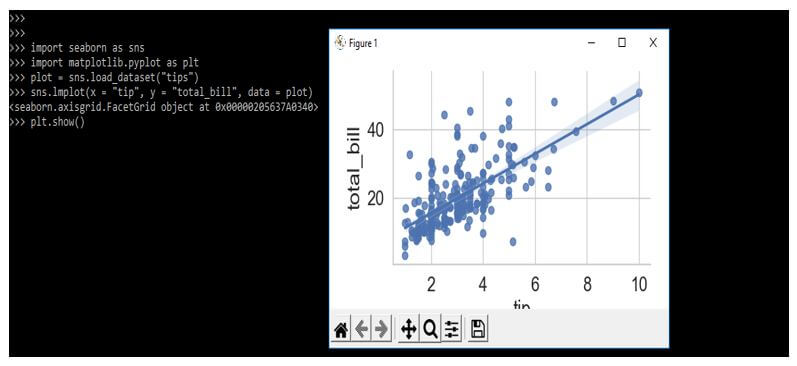
The seaborn implot method draws the scatter plot in a facetgrid. By using the implot method, we are using different input parameters. We are plotting a scatter plot with a regression line as follows.
Code:
import seaborn as sns
import matplotlib.pyplot as plt
plot = sns.load_dataset("tips")
sns.lmplot(x = "tip", y = "total_bill", data = plot)
plt.show()
Output:
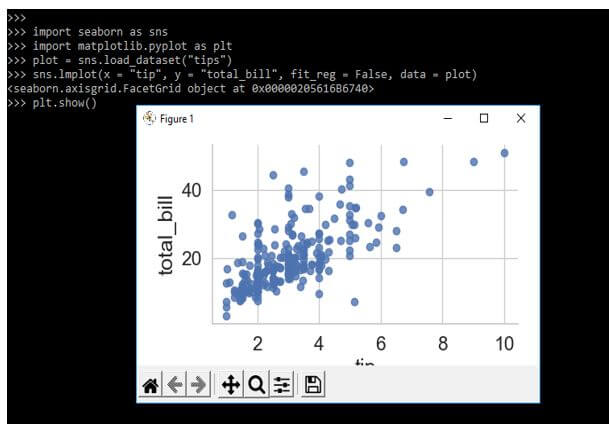
The below example shows the method without using a regression line. We are adding the fit_reg parameter for disabling the regression line as follows.
Code:
import seaborn as sns
import matplotlib.pyplot as plt
plot = sns.load_dataset("tips")
sns.lmplot(x = "tip", y = "total_bill", fit_reg = False, data = plot)
plt.show()
Output:
The below example shows the seaborn implot method by using the hue attribute. We use x, y, fit_reg, hue, and data parameters.
Code:
import seaborn as sns
import matplotlib.pyplot as plt
plot = sns.load_dataset("tips")
plot.head ()
sns.lmplot(x = "tip", y = "total_bill", fit_reg = False, hue = 'sex', data = plot)
plt.show()
Output:

Parameters of Seaborn Implot
When using the seaborn implot, we need to give input parameters. It contains multiple parameters which we need to pass at the time of creating it.
Below syntax shows seaborn implot as follows:
Syntax:
seaborn.implot(parameters)- X and y – These are input variables that were the name of columns.
- Hue – This is nothing but the variable which defines the data subsets.
- Data – This parameter is the data frame in which each column is variable, and each row is nothing but an observation.
- Palette – This parameter is the color that was used at different levels.
- Col_wrap – Wrap the variable of the column at the specified width.
- Height – It is nothing but the height of every facet.
- Aspect – It is nothing but the aspect ratio of every facet.
- Markers – It is a markers of the scatterplot.
- Share – If this parameter is true, it will share the y-axis across the columns.
- Legend – It will add legend while using the hue variable.
- X_estimator – We can apply this parameter to every unique value.
- X_bins – It will bin the discrete variables.
- X_ci – Size of the interval.
- Fit_reg – If this parameter is false, it will not draw the regression line.
- Scatterplot – If this parameter is true, it will draw the scatter plot.
- Seed – Seed of random number.
- Order – Estimate the regression.
- Lowess – If it is true, then use statsmodels.
- Robust – If it is true, then use statsmodels.
- Facet_kws – Dictionary keyword.
- Logx – Estimating the linear regression.
Examples of Seaborn Implot
Different examples are mentioned below:
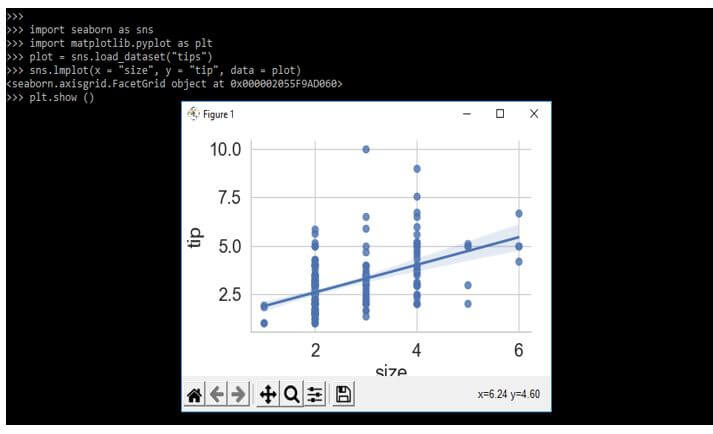
Example #1
In the below example, we are loading the data set name as tips.
Code:
import seaborn as sns
import matplotlib.pyplot as plt
plot = sns.load_dataset("tips")
sns.lmplot(x = "size", y = "tip", data = plot)
plt.show ()
Output:
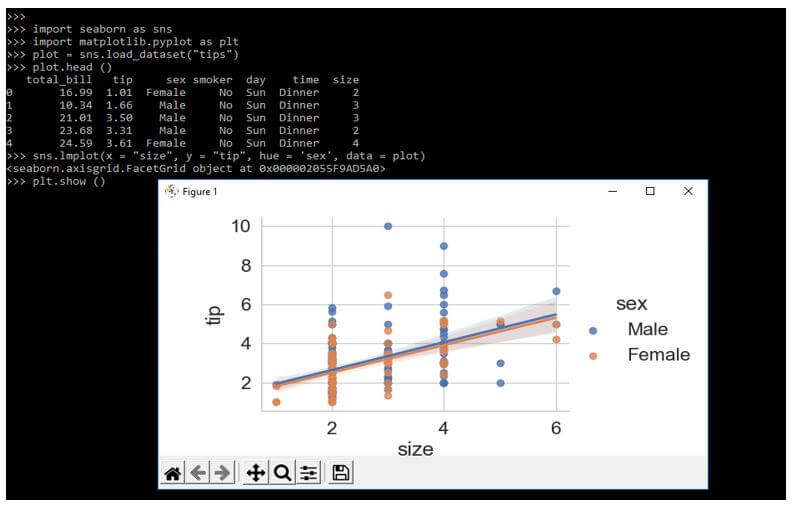
Example #2
In the below example, we are using the hue parameter to define the example
Code:
import seaborn as sns
import matplotlib.pyplot as plt
plot = sns.load_dataset("tips")
plot.head ()
sns.lmplot(x = "size", y = "tip", hue = 'sex', data = plot)
plt.show ()
Output:
FAQ
Other FAQs are mentioned below:
Q1. What is the use of seaborn implot in python?
Answer:
Seaborn implot is used for drawing the scatter plot. This is a basic plot that was used in a seaborn.
Q2. Which libraries are we using in the seaborn implot?
Answer:
We are using the numpy, pandas, seaborn, and matplotlib libraries at the time of using it.
Q3. Which method are we using to draw the seaborn implot?
Answer:
We are using the seaborn implot method or function to draw the seaborn implot in python.
Conclusion
It is beneficial when we are working on a complicated data set. It is a method used to draw the plot of scattering on the facet grid, regression model, and the facet data if fitting across the facet grid.
Recommended Articles
This is a guide to Seaborn Implot. Here we discuss the introduction, how to add seaborn implot? Method and examples with FAQ, respectively. You may also have a look at the following articles to learn more –
