Updated March 17, 2023
Introduction to Seaborn 3D Plot
Seaborn 3d plot is used to plot the graph in three-dimensional coordinates; we are plotting different patterns of 3d graphs by using the configuration of three-dimensional coordinates. One feature incentivized it to see graphs dynamically by using 3d graphics. We can include immersive graphics by using seaborn 3d graphics. We are importing the libraries, including the function for creating 3d graphs.

Key Takeaways
- It is suitable for making surface plots. In the surface plot, we define each point using three variables, i.e., altitude, longitude, and latitude.
- We required two types of input while designing it in python, i.e., format and rectangular matrix.
What is a Seaborn 3D Plot?
Seaborn does not have the built-in library containing the 3d plot functionality. It is an extension of a library of matplotlib and relies on 3D heavy lifting. So we can style the 3d matplotlib plot by using seaborn. For creating the 3d graph in seaborn, we need to set the projection parameter. The primary three-dimensional plot in a seaborn is the line collection of scatter plots created from the x, y, and z triples.
As per the analogy, two dimensional plots are created using the function of scattering 3d and plot 3d. The call signature for the same is identical to the two-dimensional counterparts. We can rotate the figure of a three-dimensional plot by using the method of view init. This method will accept two arguments; the first argument is nothing but an angle of our elevation, and the second argument is an angle of the graph. We can change the angle of elevation in degrees.
How to Create Seaborn 3D Plot?
The below steps show how we can create the 3d plot using Seaborn. In the first step, we are installing seaborn in our system.
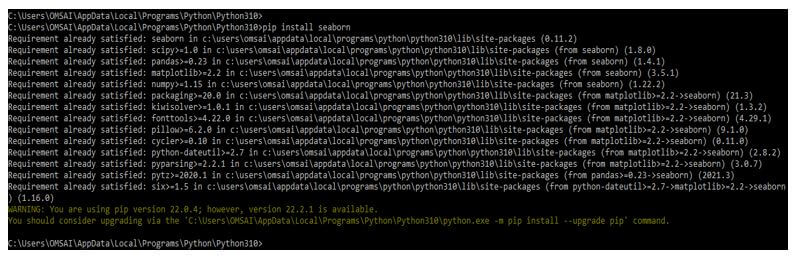
1. When creating, we are installing the seaborn package as follows.
Code:
pip install seabornOutput:
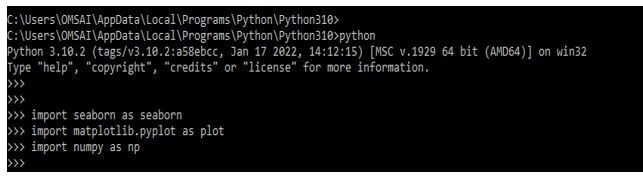
2. For checking the installation of the seaborn library and creating the 3d plot in this step, we are importing the seaborn package with the seaborn and matplotlib library. We are importing the package by using the import keyword as follows.
Code:
import seaborn as sns
import matplotlib.pyplot as plt
import numpy as np
Output:
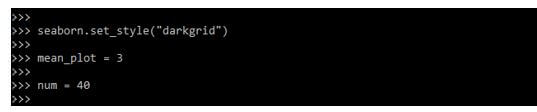
3. After importing the library in this step, we are setting the seaborn style as a darkgrid and the mean and number of the 3d graph as follows. In the example below, we are setting the mean value as 3, the number value as 40, and the style as a darkgrid as follows.
Code:
seaborn.set_style ("darkgrid")
mean_plot = 3
num = 40
Output:
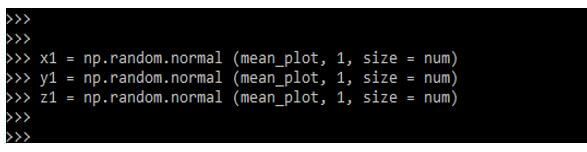
4. After defining the plot style in this step, we describe the plot axis using the random method. In the below example, we are using mean and number to draw the plot.
Code:
x1 = np.random.normal (mean_plot, 1, size = num)
y1 = np.random.normal (mean_plot, 1, size = num)
z1 = np.random.normal (mean_plot, 1, size = num)
Output:
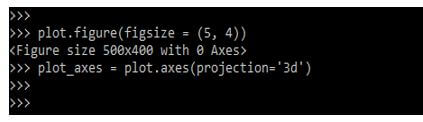
5. After defining the axis in this step, we describe the plot size. In the below example, we have defined the plot size as 5, 4; also, we are defining the plot axes projection as follows.
Code:
plot.figure(figsize = (5, 4))
plot_axes = plot.axes(projection = '3d')
Output:
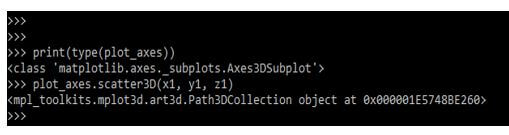
6. After defining the plot size and projection in this step, we print the plot axis and the plot graph in 3D.
Code:
print(type(plot_axes))
plot_axes.scatter3D(x1, y1, z1)
Output:
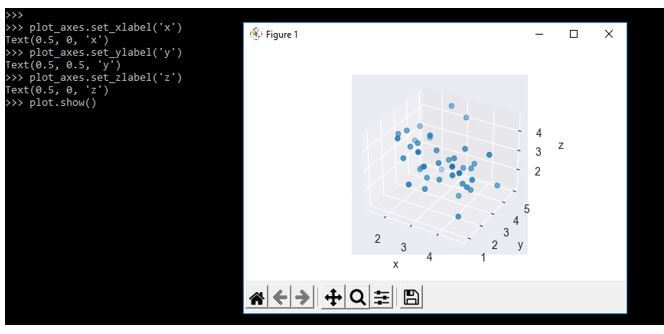
7. After printing the plot axis, we are now defining the x, y, and z labels. Also, we are plotting the graph using the show method.
Code:
plot_axes.set_xlabel('x')
plot_axes.set_ylabel('y')
plot_axes.set_zlabel('z')
plot.show()
Output:
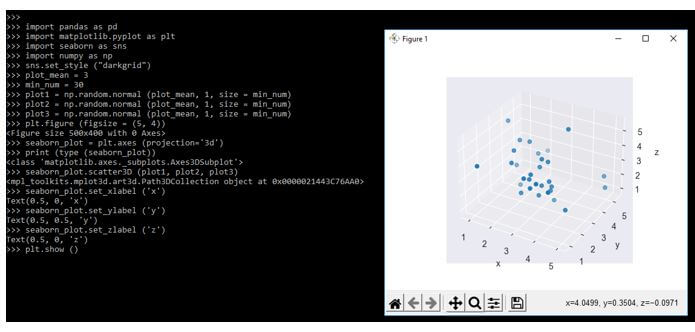
The below example shows how we can create the seaborn 3d plot as follows. In the below example, we have defined the style as a whitegrid.
Code:
import pandas as pd
import matplotlib.pyplot as plt
import seaborn as sns
import numpy as np
sns.set_style ("darkgrid")
plot_mean = 3
min_num = 30
plot1 = np.random.normal (plot_mean, 1, size = min_num)
plot2 = np.random.normal (plot_mean, 1, size = min_num)
plot3 = np.random.normal (plot_mean, 1, size = min_num)
plt.figure (figsize = (5, 4))
seaborn_plot = plt.axes (projection='3d')
print (type (seaborn_plot))
seaborn_plot.scatter3D (plot1, plot2, plot3)
seaborn_plot.set_xlabel ('x')
seaborn_plot.set_ylabel ('y')
seaborn_plot.set_zlabel ('z')
plt.show ()
Output:
Examples of Seaborn 3D Plot
Different examples are mentioned below:
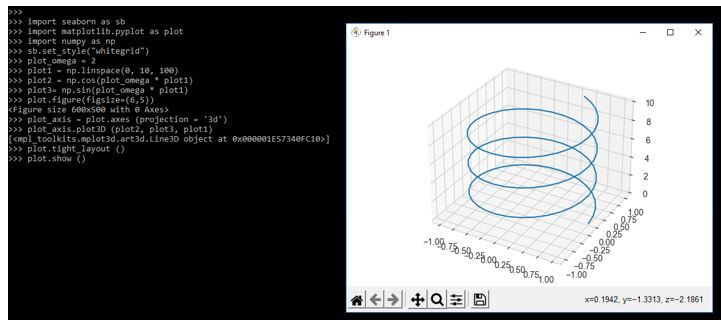
Example #1
In the below example, we are defining the set style as whitegrid as follows.
Code:
import seaborn as sb
import matplotlib.pyplot as plot
import numpy as np
sb.set_style("whitegrid")
plot_omega = 2
plot1 = np.linspace(0, 10, 100)
plot2 = np.cos(plot_omega * plot1)
plot3 = np.sin(plot_omega * plot1)
plot.figure(figsize=(6,5))
plot_axis = plot.axes (projection = '3d')
plot_axis.plot3D (plot2, plot3, plot1)
plot.tight_layout ()
plot.show ()
Output:
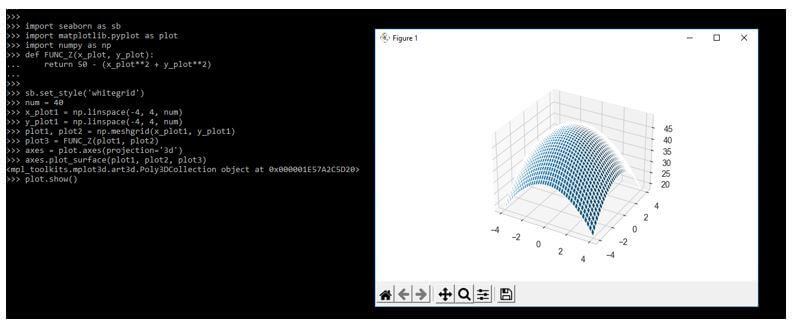
Example #2
In the below example, we are 40 intervals between -4 and 4. We are creating a grid instead of an x and y value.
Code:
import seaborn as sb
import matplotlib.pyplot as plot
import numpy as np
def FUNC_Z(x_plot, y_plot):
    return 50 - (x_plot**2 + y_plot**2)
sb.set_style('whitegrid')
num = 40
x_plot1 = np.linspace(-4, 4, num)
y_plot1 = np.linspace(-4, 4, num)
plot1, plot2 = np.meshgrid(x_plot1, y_plot1)
plot3 = FUNC_Z(plot1, plot2)
axes = plot.axes(projection='3d')
axes.plot_surface(plot1, plot2, plot3)
plot.show ()
Output:
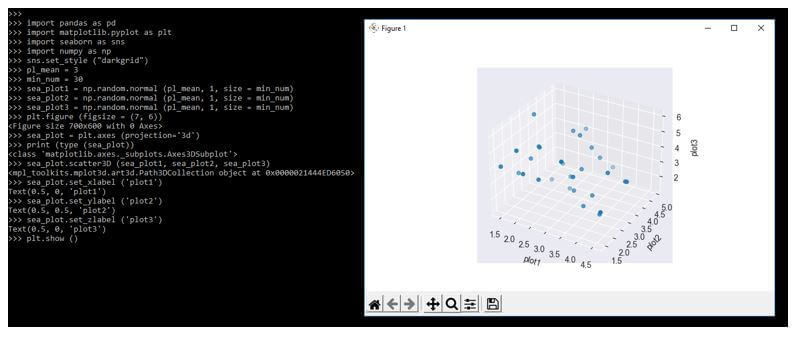
Example #3
In the below example, we are setting the style as darkgrid.
Code:
import pandas as pd
import matplotlib.pyplot as plt
import seaborn as sns
import numpy as np
sns.set_style ("darkgrid")
pl_mean = 3
min_num = 30
sea_plot1 = np.random.normal (pl_mean, 1, size = min_num)
sea_plot2 = np.random.normal (pl_mean, 1, size = min_num)
sea_plot3 = np.random.normal (pl_mean, 1, size = min_num)
plt.figure (figsize = (7, 6))
sea_plot = plt.axes (projection='3d')
print (type (sea_plot))
sea_plot.scatter3D (sea_plot1, sea_plot2, sea_plot3)
sea_plot.set_xlabel ('plot1')
sea_plot.set_ylabel ('plot2')
sea_plot.set_zlabel ('plot3')
plt.show ()
Output:
FAQ
Other FAQs are mentioned below:
Q1. What is the use of a seaborn 3d plot in python?
Answer:
By using it, we are plotting the graph using three dimensions. We use the x, y, and z-axis to plot the graph.
Q2. Which libraries do we require to plot the 3d graph in python?
Answer:
We required the numpy, seaborn, and matplotlib library.
Q3. Which graph is used to plot the seaborn 3d graph in python?
Answer:
We are using a seaborn scatter plot in seaborn for plotting the seaborn 3d plot in python.
Conclusion
Seaborn is an extension of a library of matplotlib and relies on 3D heavy lifting. It is used to plot the graph in three-dimensional coordinates; we are plotting different patterns of 3d graphs by using the configuration of three-dimensional coordinates.
Recommended Articles
This is a guide to Seaborn 3D Plot. Here we discuss the introduction, examples, and how to create it with FAQ. You may also have a look at the following articles to learn more –
