Updated March 15, 2023
Introduction to Seaborn regplot
The Seaborn regplot method plots the data model to fit linear regression. There are multiple options available for regression model estimation. That seaborn is nothing but the library of data visualization, which was based on the matplotlib. It provides a high interface level for drawing informative and statistical graphics. Seaborn graphics is beneficial and essential in python.
Key Takeaways
- Seaborn is the matplotlib-based library; using this library, we can plot various types of graphs in python.
- Using the seaborn regression method, we can plan different types of graph fitting in the linear regression model. We can plot a chart by using the seaborn regplot method.
What is Seaborn regplot?
The plot of regression in a seaborn is primarily intended to add a visual guide for emphasizing the patterns from the dataset during data analysis. As the name suggests regression plot creates the line of regression between two different parameters, and it will help us visualize the linear relationships. Seaborn is providing built-in datasets. It is not only the visualization library.
Below is the syntax as follows:
Syntax:
seaborn.regplot(parameters)Seaborn regplot contains the number of options that estimates the model of regression. We are using multiple input parameters when working with the seaborn regplot method. X and Y are input variables; when input is a string, it should correspond with the column names. The axis will be labeled as the series’ name when we use the panda’s object. Data is another critical parameter while using regplot in seaborn. The data parameter is the data frame in which each row is an observation and column is a variable. Lowess is the optional parameter used; this parameter takes the Boolean value. Color parameter is used to apply elements of all plots. We can also use marker parameters for using the glyphs of the scatterplot.
How to Use Seaborn regplot Function?
Below steps shows how we can use the function of the seaborn regplot as follows:
For using the seaborn regplot, first, we install the seaborn in our system; we can install the same using the below command.
1. While using the seaborn regplot in the first step, we are installing a seaborn package as follows.
Code:
pip install seabornOutput:
2. While installing the package of seaborn in this step we import the seaborn package in our project. We are importing the seaborn packages by using the import keyword as follows. At the time of importing seaborn package, we are also importing the pyplot package.
Code:
import seaborn as sns
import matplotlib.pyplot as plt
Output:
3. While importing the library package of seaborn, now we are loading the data set. Below example, we are loading the data set name as mpg as follows. We are loading the dataset in python by using the function name load_dataset.
Code:
df = seaborn.load_dataset('mpg')Output:
4. After loading the dataset now we are checking the data which was present in the specified data set as follows.
Code:
df.head()Output:
5. In the above example we are checking the data from the dataset, now in this step, we are plotting the seaborn regplot by using the above data as follows.
Code:
sns.regplot( )
plt.show ()
Output:
Seaborn regplot Method
Multiple cardinality approaches are available in seaborn to evaluate the regression model. When our predictive output is continuous and contains the cumulative value, it will be referred to as a prediction model. The most basic module is a linear module in seaborn; it will integrate the importance of space of higher dimensional, which passes through all the vertices.
The function of regplot is used for creating the plots of regression.
Regression analysis is the technique that was used in seaborn for evaluating the associations between single or more predictors or independent factors. The requirement variation correlates with the modification specified through the regression analysis. The declarative requirement criteria depend on the indicators giving the new value to the dependent attribute, which was updated.
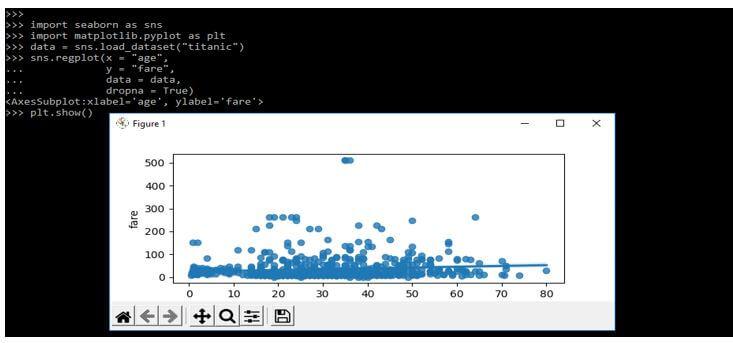
Below example shows the method of seaborn regplot as follows:
Code:
import seaborn as sns
import matplotlib.pyplot as plt
data = sns.load_dataset ("titanic")
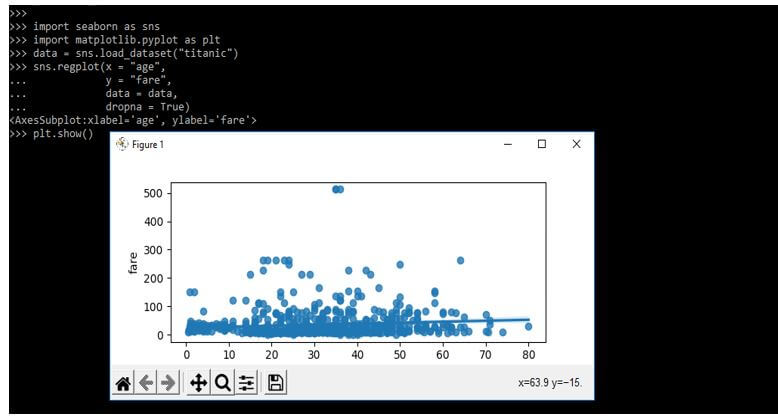
sns.regplot(x = "age",
  y = "fare",
  data = data,
  dropna = True)
plt.show()
Output:
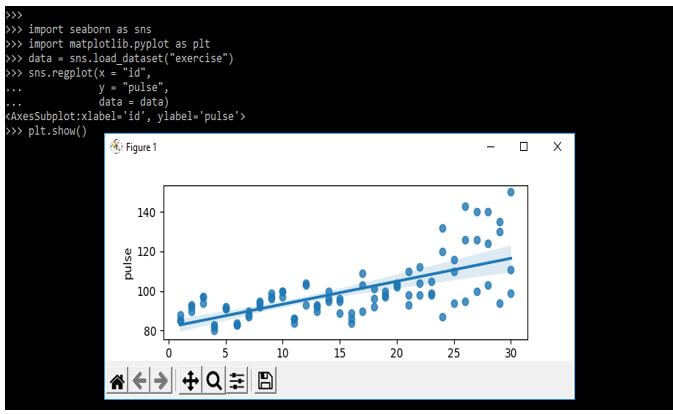
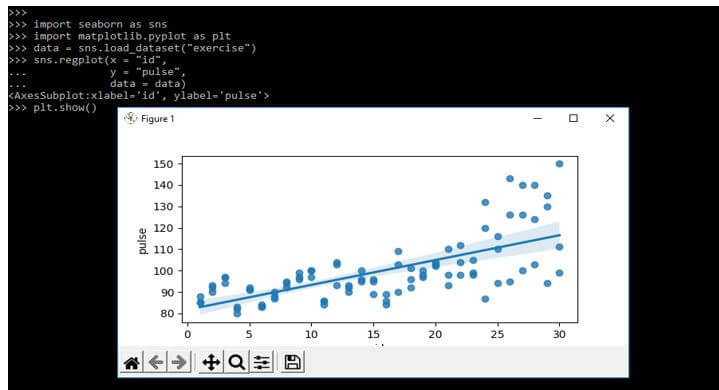
In the below example, we are using the dataset name as an exercise at the time of defining the method as follows. We can see that we are importing the module of seaborn as follows:
Code:
import seaborn as sns
import matplotlib.pyplot as plt
data = sns.load_dataset("exercise")
sns.regplot (x = "id",
  y = "pulse",
  data = data)
plt.show()
Output:
Examples of Seaborn regplot
Given below are the examples mentioned:
Example #1
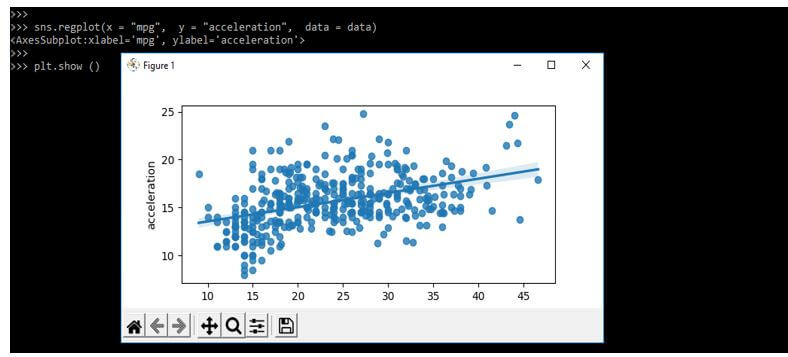
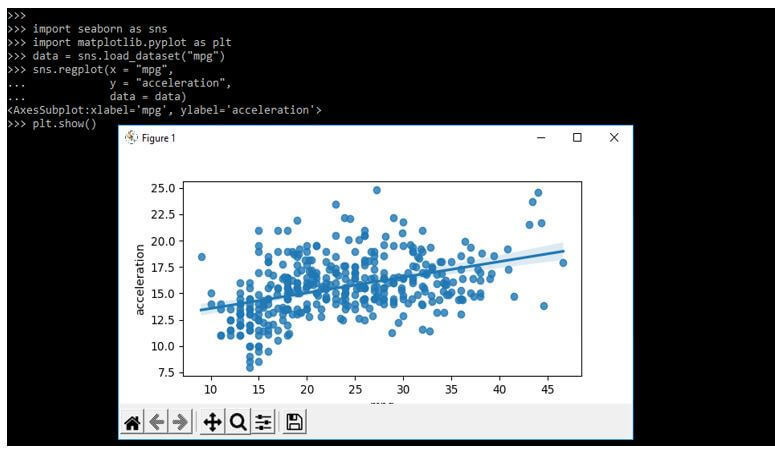
Below is the example of a seaborn regplot as follows. In the below example, we are using the data frame as mpg.
Code:
import seaborn as sns
import matplotlib.pyplot as plt
data = sns.load_dataset("mpg")
sns.regplot(x = "mpg",
  y = "acceleration",
  data = data)
plt.show()
Output:
Example #2
In the below example, we are applying the method of regplot. Also, we are using the dataset name titanic as follows.
Code:
import seaborn as sns
import matplotlib.pyplot as plt
data = sns.load_dataset("titanic")
sns.regplot(x = "age",
  y = "fare",
  data = data,
  dropna = True)
plt.show()
Output:
Example #3
The below example shows the use of the method for creating the regression plot. In the below example, we are using the dataset name as an exercise.
Code:
import seaborn as sns
import matplotlib.pyplot as plt
data = sns.load_dataset("exercise")
sns.regplot(x = "id",
  y = "pulse",
  data = data)
plt.show()
Output:
FAQ
Given below are the FAQ mentioned:
Q1. What is the use of seaborn regplot in python?
Answer:
The method of seaborn regplot is used to plot the linear regression model. By using this model we can plot the graph as per data.
Q2. What is visualizing regression models?
Answer:
Many of the datasets contain quantitative variables, and our goal of the analysis is for relating those variables. By using visualizing regression model we can plot the graph.
Q3. What is the use of the linear regression model in seaborn?
Answer:
There is two functions used in python for determining the regression i.e. regplot and lmpplot. That function is closely related to each other.
Conclusion
It contains the number of options that estimates the regression model. We are using multiple input parameters at the time working with the seaborn regplot method. It is used to plot data models to fit linear regression. There are a multiple number of options available for regression model estimation.
Recommended Articles
This is a guide to Seaborn regplot. Here we discuss the introduction, and how to use the seaborn regplot function. method, examples, and FAQ. You may also have a look at the following articles to learn more –

