Updated March 17, 2023
Introduction to Seaborn Styles
In Seaborn styles, we can customize the size of elements such as a grid, colors, and vertices from the library of seaborn to alter the illustration displayed. We can specifically think about the particular audience backdropping while determining and defining the graphics. The design of a seaborn module and grey backdrop is seen very well. Seaborn styles are instrumental and essential in python.

Key Takeaways
- When developing any application to draw an attractive, we must create an engaging plot using seaborn styles in python.
- Python matplotlib library is highly customizable, but it will be hard to know which settings are required to achieve an attractive plot.
What are Seaborn Styles?
There are different types of integrated patterns available in seaborn. The method of seaborn style is used for creating patterns. The style parameter controls the properties for the color of the background and the grid enabled by default. Seaborn contains the default configuration, which was applied with the set method. The seaborn style is overriding by using pandas and matplotlib. Data visualization is one step for making the visualized data in another step. Visualization plays a vital role in quantitative insights and catching attention. Seaborn’s figure style will affect the things like axes and color.
Using Seaborn Styles
Seaborn graphs are customized by utilizing the different patterns which were inbuilt. We are designing seaborn charts using patterns, but we can modify this to accommodate the visualization requirement.
Below example shows a built-in style plot using seaborn as follows:
Code:
import seaborn as sns
import matplotlib.pyplot as plt
plot = sns.load_dataset('tips')
sns.set_style ("darkgrid")
sns.stripplot ()
plt.show ()
Output:

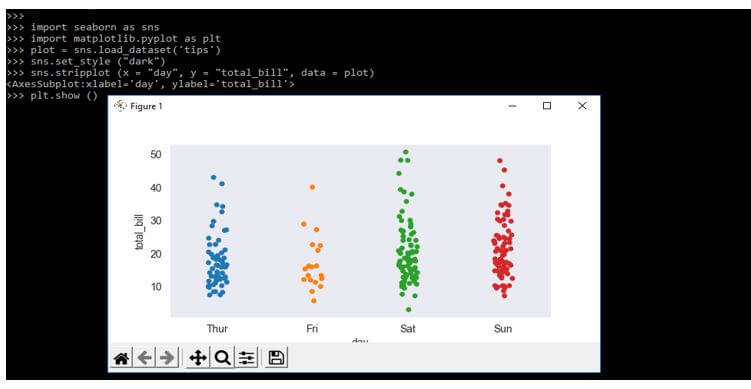
The below example shows the background hue of the plot. We are considering one element while designing the appearance for any presentation for the backdrop hue of the graph. The difference between the color scheme of the graph and the chart backdrop id more visible for analysis of the graph.
Code:
import seaborn as sns
import matplotlib.pyplot as plt
plot = sns.load_dataset('tips')
sns.set_style ("dark")
sns.stripplot ()
plt.show ()
Output:
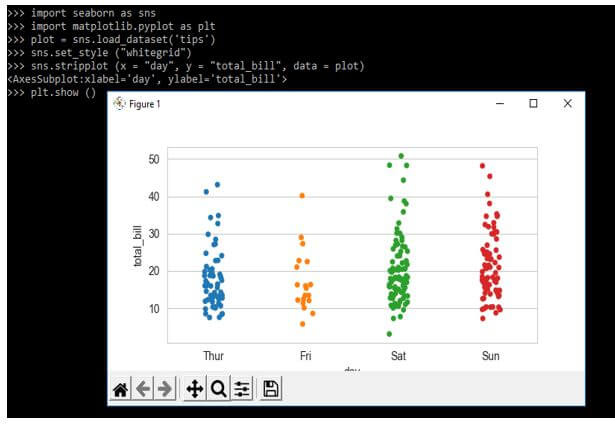
The below example shows the plot grid style. We can specify the grid in the backdrop of the graph in addition to the backdrop hue. The default template contains the grid. At the time, we want to make inferences regarding the adequate solution. The grid will enable the viewers to understand the graph.
Code:
import seaborn as sns
import matplotlib.pyplot as plt
plot = sns.load_dataset('tips')
sns.set_style ("whitegrid")
sns.stripplot ()
plt.show ()
Output:
The example below shows the seaborn style using a despine style plot. We are specifying the vertices used in adjusting the color scheme of the backdrop. The graphic will contain four vertices. For different purposes, users will eliminate single or multiple vertices. By using the method of despine, we are removing the entire vertices. We are invoking this method after the creation of the map.
Code:
import seaborn as sns
import matplotlib.pyplot as plt
plot = sns.load_dataset('tips')
sns.set_style ("whitegrid")
sns.stripplot ()
sns.despine (left=True, bottom=True)
plt.show ()
Output:

Seaborn Styles Colors
Below is the way of styling the themes as follows.
Seaborn-style colors are essential in python.
- White
- Dark
- Whitegrid
- Ticks
- Darkgrid
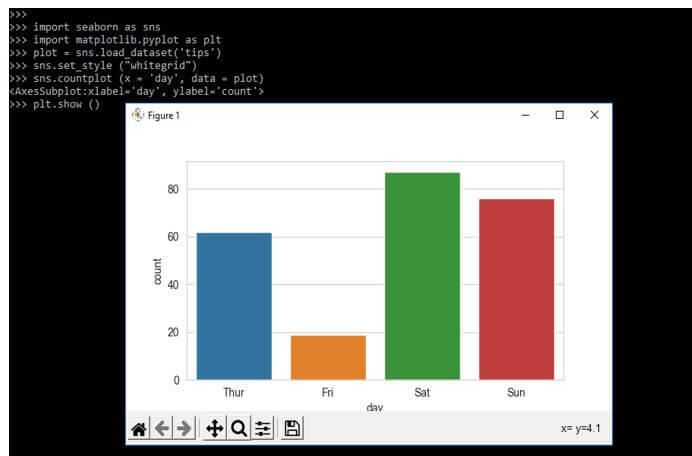
The below example shows to set the background as white. With the help of the dataset and the countplot, the style represents the seaborn.
Code:
import seaborn as sns
import matplotlib.pyplot as plt
plot = sns.load_dataset('tips')
sns.set_style ("whitegrid")
sns.countplot (x = 'day', data = plot)
plt.show ()
Output:
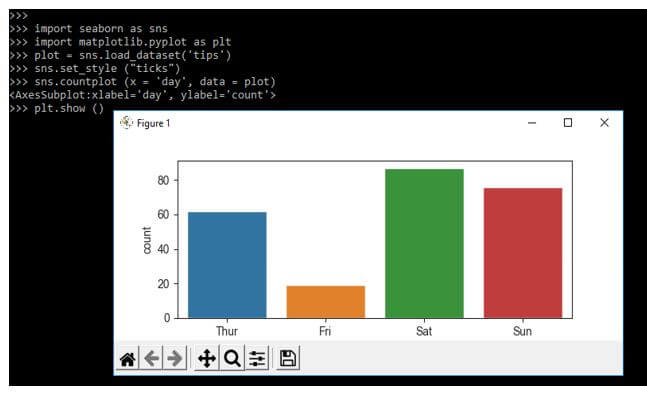
The below example shows to set the background as ticks. Ticks will appear on the plot side by selecting the set_style. We are using the palette attribute for setting the color.
Code:
import seaborn as sns
import matplotlib.pyplot as plt
plot = sns.load_dataset('tips')
sns.set_style ("ticks")
sns.countplot (x = 'day', data = plot)
plt.show ()
Output:
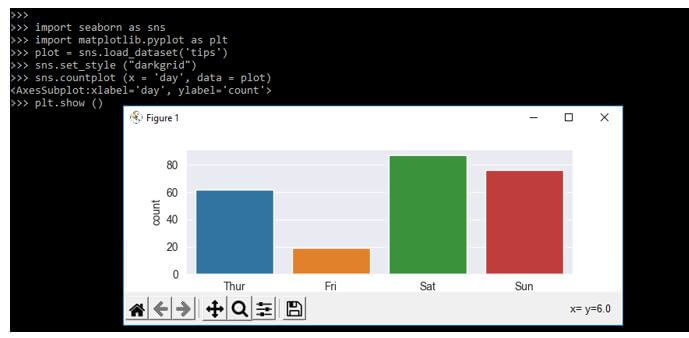
The below example shows you set the background as darkgrid. We are using the palette attribute for setting the color.
Code:
import seaborn as sns
import matplotlib.pyplot as plt
plot = sns.load_dataset('tips')
sns.set_style ("darkgrid")
sns.countplot (x = 'day', data = plot)
plt.show ()
Output:
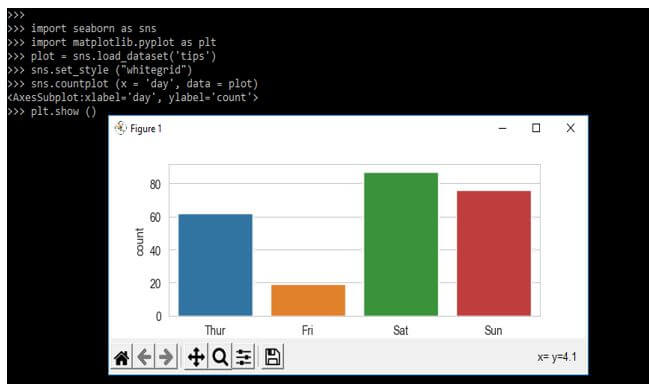
The below example shows the background as a whitegrid as follows. Whitegrid will appear on the plot side.
Code:
import seaborn as sns
import matplotlib.pyplot as plt
plot = sns.load_dataset('tips')
sns.set_style ("whitegrid")
sns.countplot (x = 'day', data = plot)
plt.show ()
Output:
Seaborn Styles Theme
The seaborn is well known for its general styling and background. We can set the theme in seaborn by using function as a set style.
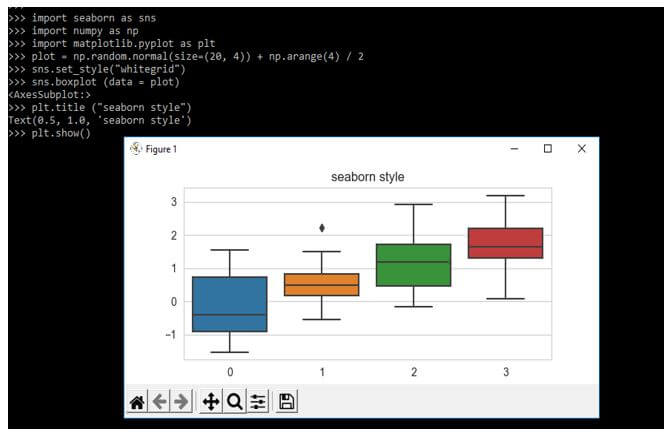
The below example shows the use of the whitegrid color as follows:
Code:
import seaborn as sns
import numpy as np
import matplotlib.pyplot as plt
plot = np.random.normal (size=(20, 4)) + np.arange (4) / 2
sns.set_style ("whitegrid")
sns.boxplot (data = plot)
plt.title ("seaborn style")
plt.show ()
Output:
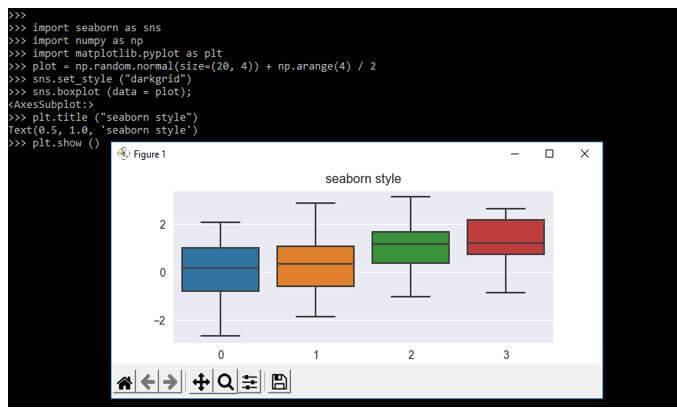
In the below example, we are using the theme style as darkgrid and the boxplot function as follows.
Code:
import seaborn as sns
import numpy as np
import matplotlib.pyplot as plt
plot = np.random.normal(size=(20, 4)) + np.arange(4) / 2
sns.set_style ("darkgrid")
sns.boxplot (data = plot);
plt.title ("seaborn style")
plt.show ()
Output:
Examples of Seaborn Styles
Different examples are mentioned below:
Example #1
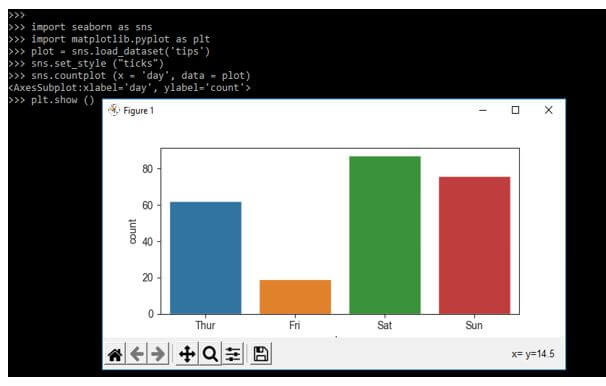
The below example shows the seaborn style as follows. In the below example, we are using the seaborn style as ticks as follows.
Code:
import seaborn as sns
import matplotlib.pyplot as plt
plot = sns.load_dataset('tips')
sns.set_style ("ticks")
sns.countplot (x = 'day', data = plot)
plt.show ()
Output:
Example #2
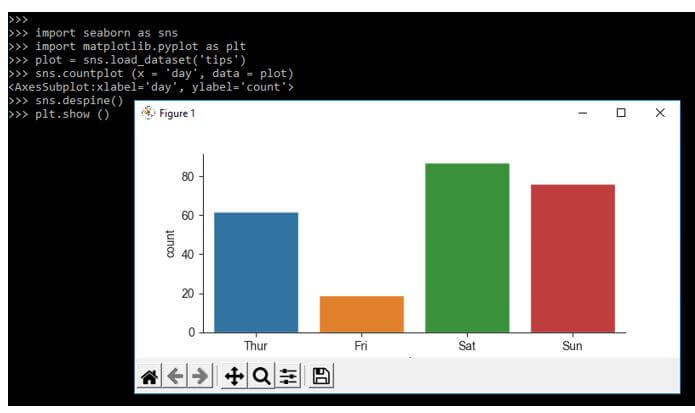
Below is an example of the despine function: removing the spines on the upper and right sides from the plot.
Code:
import seaborn as sns
import matplotlib.pyplot as plt
plot = sns.load_dataset('tips')
sns.countplot (x = 'day', data = plot)
sns.despine()
plt.show ()
Output:
Example #3
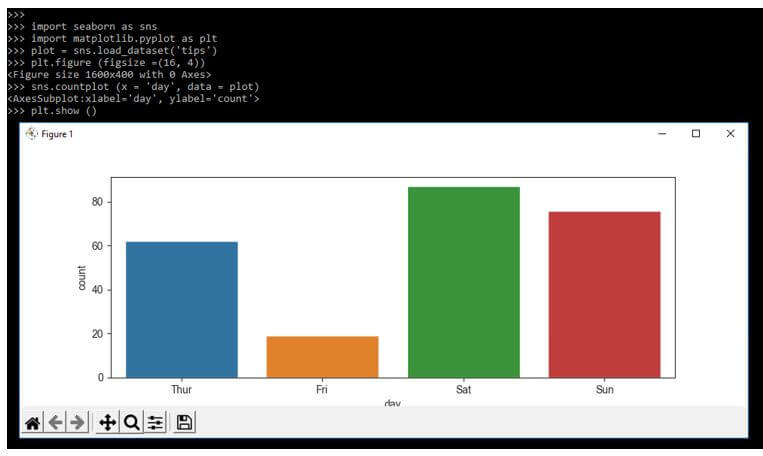
In the below example, we are defining the size and aspect of the plot by using seaborn styles as follows.
Code:
import seaborn as sns
import matplotlib.pyplot as plt
plot = sns.load_dataset('tips')
plt.figure (figsize =(16, 4))
sns.countplot (x = 'day', data = plot)
plt.show ()
Output:
FAQ
Other FAQs are mentioned below:
Q1. What is the use of seaborn styles in python?
Answer:
Using the seaborn style, we can customize the style of elements by using the grid, color, and vertices.
Q2. Which libraries are we using in seaborn styles?
Answer:
We are using the matplotlib, numpy, and seaborn library in python when we use the seaborn style.
Q3. What is the way to style the theme of the seaborn style in python?
Answer:
We can style the python seaborn theme using dark, white, darkgrid, whitegrid, and ticks styles.
Conclusion
The style parameter controls the properties for the color of the background and the grid enabled by default. In Seaborn styles, we can customize the size of elements such as a grid, colors, and vertices from the library of seaborn to alter the illustration displayed.
Recommended Articles
This is a guide to Seaborn Styles. Here we discuss the introduction, seaborn styles, colors & theme, examples, and FAQ. You may also have a look at the following articles to learn more –
