Updated March 4, 2023

Definition to Seaborn Histogram
Histogram is a Data visualization technique where the data is separated into various bins and then distributed to the range of bins and drawing bars to indicate the number of observations or data points that fall into particular bins. Histograms represent the distribution of values across each dimension of the data.
Creating Seaborn Histogram
Histogram provides a deeper understanding of the basic structure and distribution of given data. In addition to displaying the mean and standard deviation, a histogram can also show outliers and other information such as the quartiles. We could also calculate the maximum and minimum values or the interquartile range (IQR).
Seaborn is built on top of Python’s core visualization library Matplotlib. It allows developers to plot a graphical visualization using Python’s plotting language, and the code includes a tool to load it into R or Matplotlib. You can also use the data to understand how data is used, to understand your analytics project’s business, or to gain a deep understanding of the different ways customers generate data. You can start by exploring the data using Pandas.
I have created multiple histograms with a seaborn library from different data sets.
Syntax:
import seaborn as sns
data_pengui = sns.load_dataset("penguins")
sns.histplot(data = data_pengui, x="flipper_length_mm")
Output:
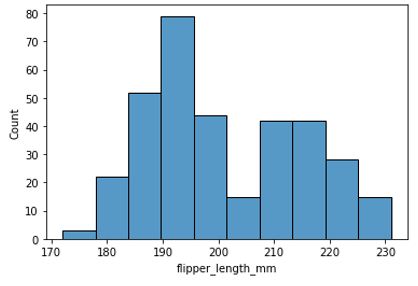
In the above example, we have plotted the histogram with the density plot for the penguin’s dataset using seaborn.histplot() function. In the first step, we have imported the seaborn library and named it sns. In the next step, we have loaded the penguin dataset into the data penguin. In the final step, we have plotted the histogram using histplot function by passing the required parameters to the function.
Syntax:
import seaborn as sns
data_pengui = sns.load_dataset("penguins")
sns.histplot(data = data_pengui, y="flipper_length_mm")
Output:
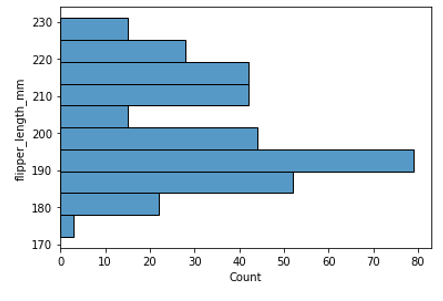
In the above example, we have interchanged the x-axis and y-axis and plotted the histogram with the density plot for the penguins dataset using seaborn.histplot() function. In the first step, we have imported the seaborn library and named it sns. In the next step, we have loaded the penguin dataset into the data penguin. In the final step, we have plotted the histogram using histplot function by passing the required parameters to the function.
Syntax:
import seaborn as sns
df = sns.load_dataset('iris')
sns.histplot(df['petal_width'],kde = False)
Output:
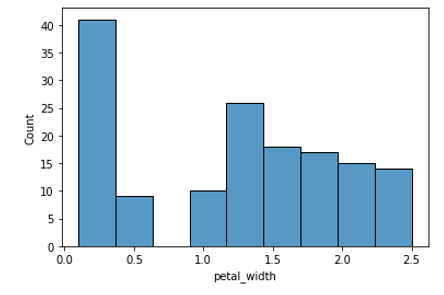
In the above example, we have plotted the histogram with the density plot for the Iris dataset using seaborn.histplot() function. In the first step, we have imported the seaborn library and named it sns. In the next step, we have loaded the penguin dataset into the df. In the final step, we have plotted the histogram using histplot function by passing the required parameters to the function.
Syntax:
import seaborn as sns
df = sns.load_dataset('iris')
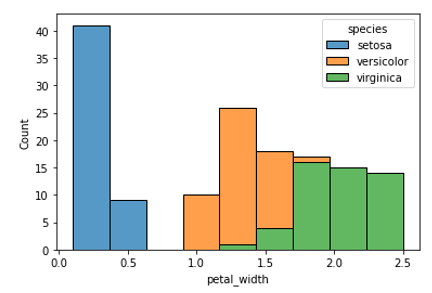
sns.histplot(data=df, x="petal_width", hue="species")Output:
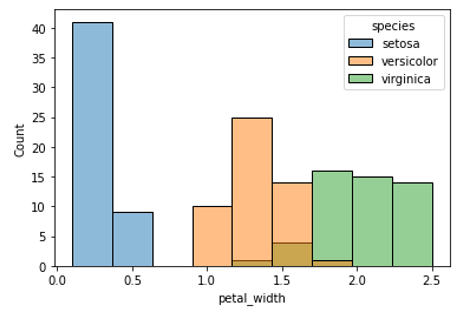
In the above example, we have plotted the histogram with the density plot for the Iris dataset using seaborn.histplot() function. In the first step, we have imported the seaborn library and named it sns. In the next step we have loaded the iris dataset into the df. In the final step, we have plotted the histogram using histplot function by passing the required parameters to the function. In this example, we have added a new parameter called hue which maps the species to different colors.
Syntax:
import seaborn as sns
df = sns.load_dataset('iris')
sns.histplot(data=df, x="petal_width", hue="species", multiple="stack")
Output:
In the above example, we have plotted the histogram with the density plot for the Iris dataset using seaborn.histplot() function. In the first step, we have imported the seaborn library and named it as sns. In the next step, we have loaded the iris dataset into the df. In the final step, we have plotted the histogram using histplot function by passing the required parameters to the function.
Syntax:
tips = sns.load_dataset("tips")
sns.displot(tips, x="size")
Output:
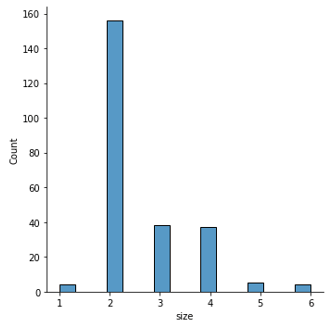
In this example, we have used the plotted histogram for the tips dataset using seaborn.distplot() function. This function is a combination of the hist function of the matplotlib library and the ruplot and kdeplot functions of the seaborn library. In the first step, we have imported the seaborn library and named it as sns. In the next step, we have plotted the histogram using distplot function by passing the required parameters to the function and the output is produced as shown in the picture.
Syntax:
import seaborn as sns
df = sns.load_dataset('iris')
sns.displot(df, x=df['petal_width'], hue="species")
Output:
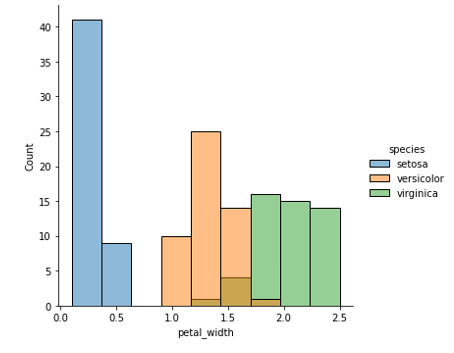
In the above example, we have used the plotted histogram for the iris dataset using seaborn.distplot() function. This function is a combination of the hist function of the matplotlib library and the ruplot and kdeplot functions of the seaborn library. In the first step, we have imported the seaborn library and named it as sns. In the next step, we have loaded the iris dataset into the df. In the final step, we have plotted the histogram using distplot function by passing the required parameters to the function.
Seaborn comes with some very important features. First, the framework offers a very lightweight framework for building and developing distributed applications and infrastructure. Its power comes from the large number of modules, which are easy to maintain and use. Second, the package is very large, mainly based on python modules which are very widely used and widely tested. Finally, the package also supports writing the code in different programming languages (such as c, C#, Java, Python, PHP, and R).
Conclusion
In this article, we have discussed the seaborn histogram with various examples. We have plotted various histograms using histplot and distplot functions and adding different parameters to the function. Seaborn is an open-source library used in a python programming language. It provides a high-quality API for data visualization. The basic structure of the API is similar to that of the Scrum framework. It consists of modules representing data streams, operations, and data manipulation. Each module contains a data type for the purpose of reading data. The module’s argument module can contain any Python object as its argument. The data module implements the main data manipulation tasks. I hope this helps. Thank you.
Recommended Articles
This is a guide to Seaborn Histogram. Here we discuss the definition, Create Multiple Histograms with Seaborn Library with examples respectively. You may also have a look at the following articles to learn more –
