Updated March 15, 2023

Introduction to Seaborn Catplot
Seaborn catplot method is used to work on the categorical data. The seaborn module contains a variety of plots; when interacting with the categorical attributes, we require a consistent strategy for plotting the graph because different plots’ functions behave differently. This procedure was not matching with the data. The method is designed to optimize the factor plot method in the seaborn module.
Key Takeaways
- The new catplot function in seaborn provides the new framework for providing access to multiple types of plots showing the relationship between numerical variables.
- Catplot function handles eight different kinds of plots; this function does all those types of plots and parameters.
What is Seaborn Catplot?
Seaborn catplot method enables the work efficiently by using the definite and render data defined in a parameter. The technique produces the object of the facet grid; it is used to plot the graphs for several types of aspects. It utilizes the scatterplot for the datasets. The scatter plot belongs to the same category for the categorical variable. There are two types of categorical plots available in seaborn.
The categorical method uses a distinct method for representing the categorical data. We can use the second method for an algorithm for changing the points by using the axis category to avoid overlapping. It will visualize the observations range more accurately.
We can refer to this type of plot as beeswarm, and we can implement the same by using a swarm plot which we can access by specifying the swarm in it. The function of the seaborn is used to work on the categorical data. This function is built on the factorplot function, representing the seaborn module version. By default, the catplot is used as the scatterplot for expressing the data.
How to Create Seaborn Catplot?
Below steps shows how we can create the seaborn catplot as follows:
For creating the method of seaborn catplot first, we can install the seaborn by using different types. We also need to install the package matplotlib.
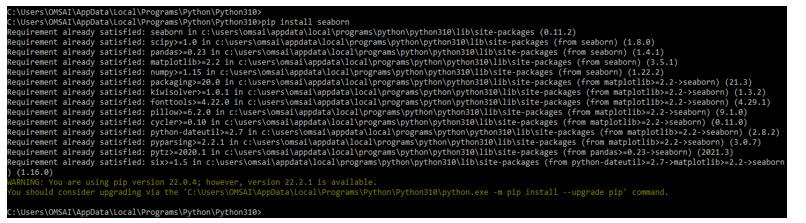
1. When using the seaborn catplot below, we are installing a package of seaborn as follows.
Code:
pip install seabornOutput:
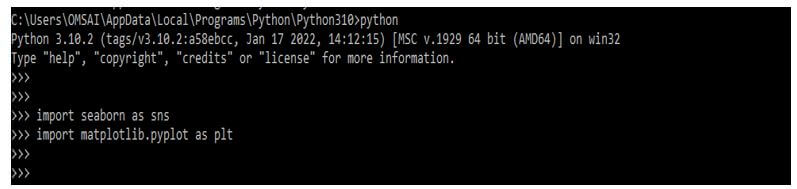
2. In the below example, we can see that we are importing the package of seaborn and pyplot in our code because it will require to run the code of catplot. Without importing those packages, we cannot use the catplot function in our code; it will show an error that an undefined function is used.
Code:
import seaborn as sns
import matplotlib.pyplot as plt
Output:
3. While importing the seaborn library package below, we are loading the data set name as tips by using the function of load_dataset, which we used to load the data into the python language.
Code:
df = sns.load_dataset ('tips')Output:

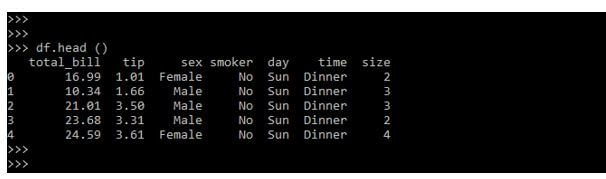
4. In the below example, we can see that dataset records were present in the dataset name as tips. We are retrieving these records by using the below command.
Code:
df.head ()Output:
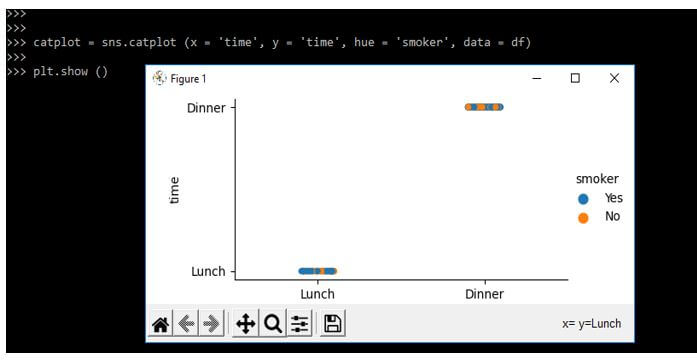
5. After checking all the data from the dataset, now, in this example, we are using the catplot function to draw the catplot as follows. In the below example, we are using the x, y, hue, and data parameters to plot the graph as follows.
Code:
catplot = sns.catplot (x = 'time', y = 'time', hue = 'smoker', data = df)
plt.show ()
Output:
Seaborn Catplot Parameters
Below is the syntax of seaborn catplot as follows. The syntax of catplot contains the multiple parameters as follows:
Syntax:
seaborn.catplot(parameters)- Hue, x, and y – This parameter contains the name of variables in data input for plotting the data.
- Data – This parameter is nothing but the frame of data. Each column from the dataset corresponds to this parameter.
- Row, col – This parameter contains the name of a variable. This is an optional parameter used.
- Kind – Kind is also an optional parameter used in a function of the seaborn catplot.
- Color – This parameter uses the color of matplotlib. This is the color for all elements or its speed of gradient.
- Palette – This parameter is the name of the palette. This is the color used in different levels of the hue variable.
- Kwargs – This parameter is used for key-value pairing.
- Height – Represent the facet height.
- Aspect – Ratio of every aspect.
- Orient – Represents the orientation of the plot.
- Seed – Random order seed.
- Estimator – Estimates the statistical function.
- Col_wrap – Wrap the variable of the column.
- Legend – Used to draw legend on the plot.
- N_boot – Bootstrap iterations number.
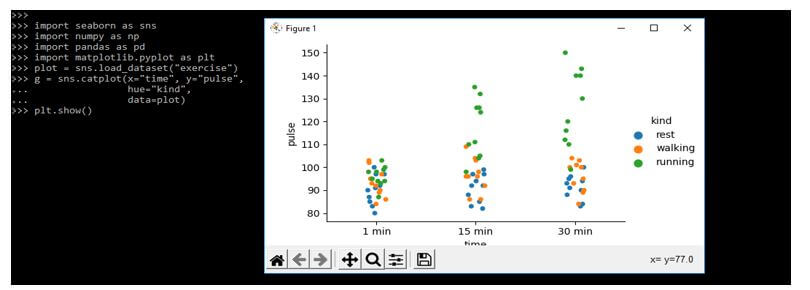
Code:
import seaborn as sns
import numpy as np
import pandas as pd
import matplotlib.pyplot as plt
plot = sns.load_dataset("exercise")
g = sns.catplot
  (x="time", y="pulse",
  hue="kind",
  data=plot)
plt.show()
Output:
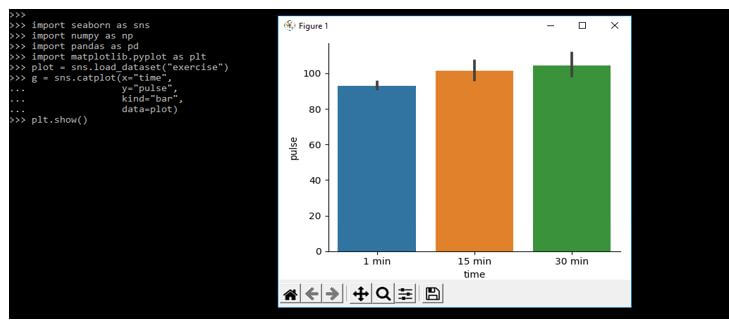
Example #2
In the below example, we are plotting the bar plot by using it. We are using the same dataset name as the exercise.
Code:
import seaborn as sns
import numpy as np
import pandas as pd
import matplotlib.pyplot as plt
plot = sns.load_dataset("exercise")
g = sns.catplot(x="time",
  y="pulse",
  kind="bar",
  data=plot)
plt.show()
Output:
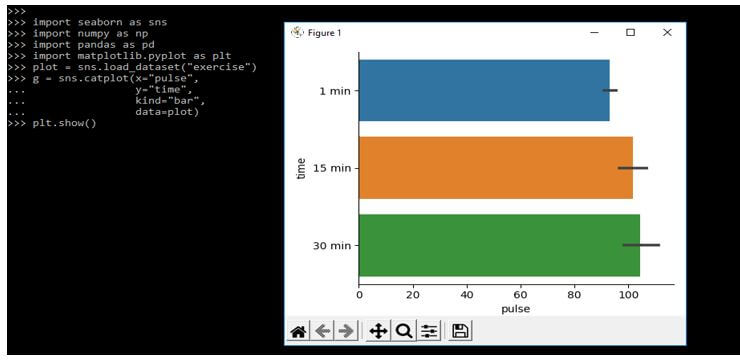
Example #3
In the below example, we are plotting the horizontal bar plot. For plotting the horizontal bar plot we need to change the feature of an x and y axis.
Code:
import seaborn as sns
import numpy as np
import pandas as pd
import matplotlib.pyplot as plt
plot = sns.load_dataset("exercise")
g = sns.catplot(x="pulse",
  y="time",
  kind="bar",
  data=plot)
plt.show()
Output:
FAQ
Given below are the FAQ mentioned:
Q1. What is the use of seaborn catplot in python?
Answer:
It is very easy to use and it will require less code. We can built multiple types of plots by using seaborn catplot.
Q2. Which libraries do we need to use while using seaborn catplot?
Answer:
We need to use the seaborn and pyplot libraries at the time of using catplot in the python project.
Q3. How many types of plot we can draw using seaborn catplot?
Answer:
We can draw the eight types of plot by using seaborn catplot in python. We can also draw horizontal as well as vertical plots.
Conclusion
The categorical method uses a distinct method for representing the data which was categorical. The seaborn module contains variety of plots, at the time interacting with the attributes which were categorical we require a consistent strategy for plotting the graph because the function of different plots is behaving differently.
Recommended Articles
This is a guide to Seaborn Catplot. Here we discuss the introduction, and how to create seaborn catplot? parameters, examples, and FAQ. You may also have a look at the following articles to learn more –
