Updated March 16, 2023
Introduction to Seaborn Subplots
The Seaborn subplots module contains the methodologies; we can draw multiple plots in one figure using this. At the time, drawing repeated examples of the identical group’s data was a very efficient strategy for analyzing multi-dimensional statistics. The seaborn subplots method is also known as the graphing of matrix polytonal, and it will link with the multiple set of compact notions.

Key Takeaways
- Aligning the rows and columns to the subplots is a common need for the matplotlib, which contains several routines that make creating a subplot easy.
- The lowest level of the subplots is creating the single subplots within the specified grid we have assigned.
What are Seaborn Subplots?
It allows for retrieving lots of data from intricate sources. Seaborn is extending the capability of functionality for the matplotlib to create graphics, which include many axes. It provides the user functionality to securely connect with the chart framework for the data frame topology. Visualization of the data is an essential part of any workflow of machine learning technology.
Sometimes in a seaborn subplot, comparing data from different views is beneficial. In matplotlib, subplots are a group of similar axes in a single figure. Using it, we can plot, grid, or insert the layouts, which is more complicated. In seaborn, the primary method of creating axes is to use the function name as plt.axes. By default, seaborn is making the standard axes filling all the figures. The function of plt.axes also takes the optional argument, which contains the four numbers in a coordinate system. The number of seaborn subplots will represent the width, height, left, and bottom of the figure coordinate system, ranging from 0 at the left of the bottom and one at the top of the right.
How to Use Seaborn Subplots?
Using the seaborn subplots, we can manage the 1*2 subplots by utilizing the code that was succeeding. The elements of axes are applied for drawing the subplots. The arguments of the ax in the subplot method are used and provide the appropriate position for the subplots.
The below example shows how we can use the seaborn subplots as follows. In the below example, we are importing the library of seaborn, pandas, and matplotlib as follows.
Code:
import pandas as pd
import matplotlib.pyplot as plt
import seaborn as sns
df = pd.DataFrame({"plot 1": [11,22,66,77,101,111,121,91],
                  "plot 2": [21,41,61,81,101,121,141,161],
                  "Subplot": [11,31,51,71,91,11,21,41],})
fig, axes = plt.subplots(1, 2)
sns.lineplot(x = 'Subplot', y = 'plot 1', data = df, ax = axes[0])
sns.lineplot(x = 'Subplot', y = 'plot 2', data = df, ax = axes[1])
axes[0].set_title ("Subplot 1")
axes[1].set_title("Subplot 2")
plt.suptitle ("Subplots")
plt.show()
Output:

By using the support of this function, we can define the series data. We have initialized three different arrays. After determining the array, we call the function of subplots.
We are also using the line plot method of the seaborn library; also, we have provided four different arguments to that specified function. We have also defined the labels of the y and x axis by using the data set. Using the ax attribute, the axes of each line plot were indicated. We are calling the set title method for specifying the captions of both plots. Before displaying all the plots, we utilize the function name as a subtitle from the library of a pyplot.
Step by Step Create Seaborn Subplots
Below steps shows how to create seaborn subplots as follows:
For making the seaborn subplots, first, we install the seaborn in our system; we can install the same using the below command.
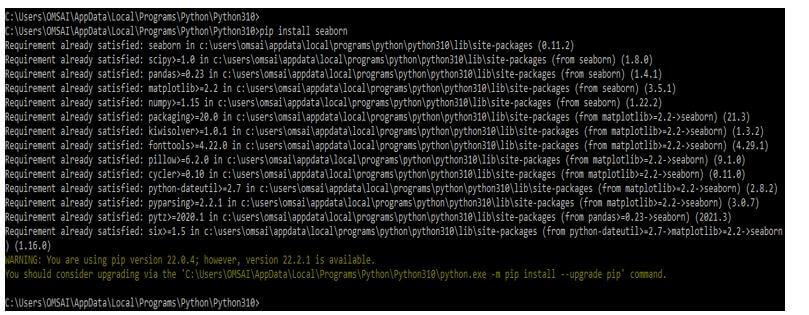
1. While creating the seaborn subplots in the first step, we are installing a package of seaborn as follows.
Code:
pip install seabornOutput:
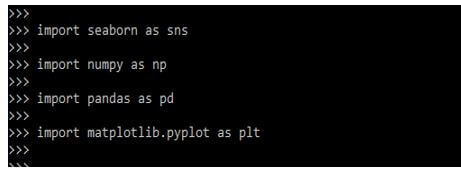
2. While installing the seaborn package in this step, we are importing the seaborn package into our project. At the time of importing the seaborn package, we are also importing the pyplot package as follows.
Code:
import seaborn as sns
import matplotlib.pyplot as plt
import pandas as pd
import numpy as np
Output:
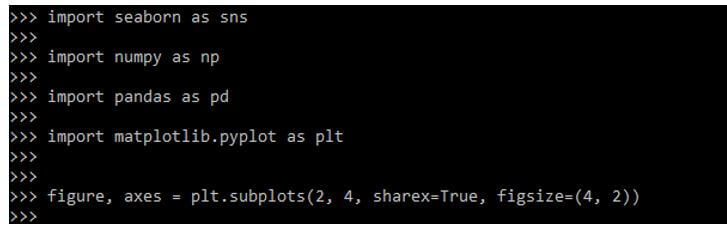
3. While importing the library package of seaborn, we are now defining the subplot function axis and the coordinated figure we are plotting. We are providing the size of the plot. We are providing the subplot axis as follows.
Code:
figure, axes = plt.subplots(2, 4, sharex = True, figsize = (4, 2))Output:
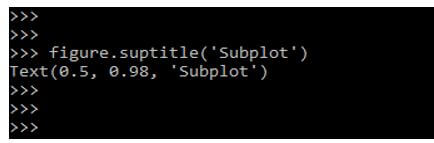
4. After defining the coordinates in this step, we call the suptitle method to specify the name of subplots.
Code:
figure.suptitle ('Subplot')Output:
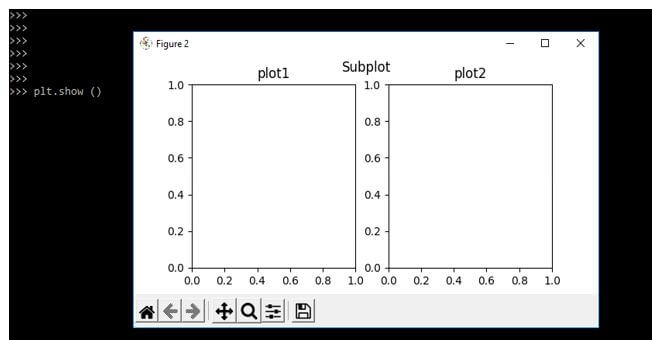
5. After defining the title of all plots, now, in this step, we are limiting the title of each plot as follows.
Code:
axes[0].set_title ('plot1')
axes[1].set_title ('plot2')
Output:

6. Now, we are plotting it by using the above data.
Code:
plt.show ()Output:
Examples of Seaborn Subplots
Given below are the examples of Seaborn Subplots:
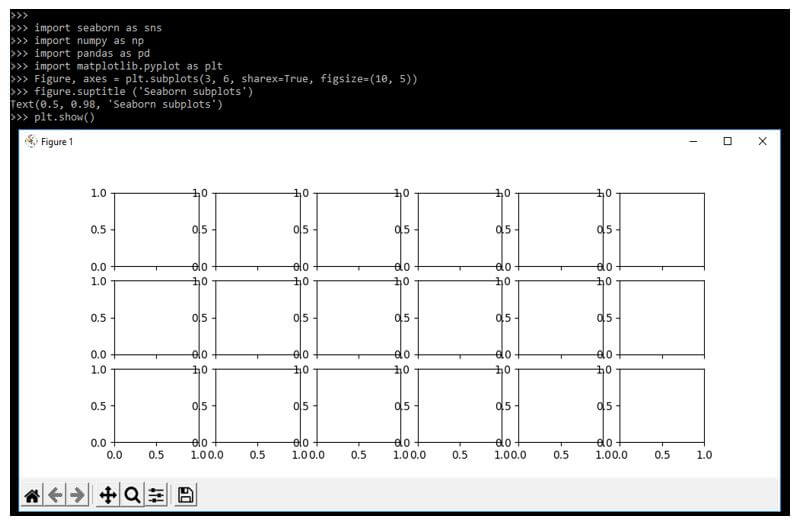
Example #1
In the below example, we are plotting multiple plots as follows.
Code:
import seaborn as sns
import numpy as np
import pandas as pd
import matplotlib.pyplot as plt
Figure, axes = plt.subplots(3, 6, sharex=True, figsize=(10, 5))
figure.suptitle ('Seaborn subplots')
plt.show()
Output:
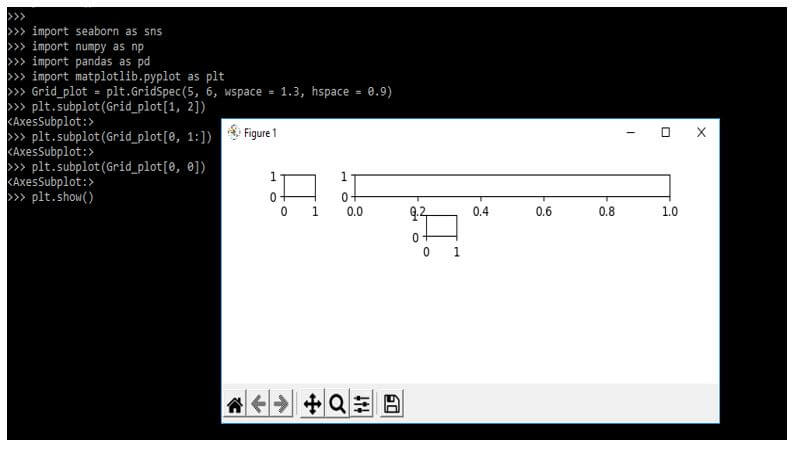
Example #2
In the below example, we are using the gridspec function with the subplots function; the gridspec function specifies the dimension of the column and row.
Code:
import seaborn as sns
import numpy as np
import pandas as pd
import matplotlib.pyplot as plt
Grid_plot = plt.GridSpec(5, 6, wspace = 1.3, hspace = 0.9)
plt.subplot(Grid_plot[1, 2])
plt.subplot(Grid_plot[0, 1:])
plt.subplot(Grid_plot[0, 0])
plt.show()
Output:
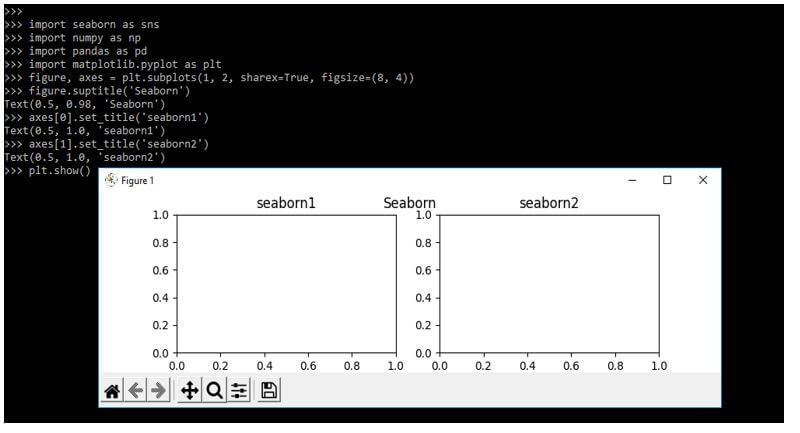
Example #3
In the example below, we plot two graphs in a single window and assign the seaborn name to the graph.
Code:
import seaborn as sns
import numpy as np
import pandas as pd
import matplotlib.pyplot as plt
figure, axes = plt.subplots(1, 2, sharex=True, figsize=(8, 4))
figure.suptitle('Seaborn')
axes[0].set_title('seaborn1')
axes[1].set_title('seaborn2')
plt.show()
Output:
FAQ
Other FAQs are mentioned below:
Q1. What is the use of seaborn subplots in python?
Answer:
The seaborn subplots are used to create multi-dimensional plots in a seaborn. We can draw multiple plots in a single figure.
Q2. Which libraries are required while using seaborn subplots in python?
Answer:
We need to import the seaborn and matplotlib are the main libraries, and also, we need to import the NumPy and pandas library.
Q3. What is the use of the suptitle function in seaborn subplots?
Answer
By using the function of suptitle in it, we can define the name of our subplots.
Conclusion
Seaborn is extending the capability of functionality for the matplotlib to create graphics, including many axes. Drawing repeated examples of identical group data is a very efficient strategy for analyzing multi-dimensional statistics.
Recommended Articles
This is a guide to Seaborn Subplots. Here we discuss the introduction, how to use & steps to create seaborn subplots, examples, and FAQ. You may also have a look at the following articles to learn more –
