Introduction to Minitab
A statistics package developed by some researchers to help six sigma professionals analyze and interpret data to help in the business process is called Minitab. The data input is simplified so that it can be easily used for statistical analysis and it also helps in manipulating the dataset. If trends, patterns and charts are given, those are analyzed and interpreted so that final conclusion can be made. The answers are given and those are magnified with the given products or services to help in the business. Problem-solving is made easy and faster with the Minitab tool.
This is a continuous process (as depicted in the figure below):
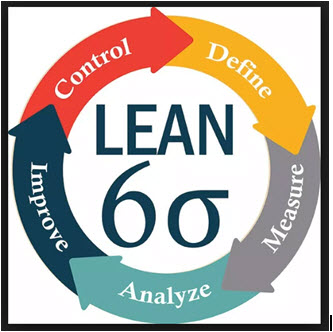
Six Sigma professionals are expected:
- To identify the pain areas in the existing processes.
- Use various tools and data formats to arrive at an optimal solution
- Implement the strategy which was agreed.
- Monitor the changes.
It helps professionals in:
- Simplifying the data input for statistical analysis
- Manipulating the dataset
- Identifying trends and patterns
- Extrapolating the answers to the existed problem with product/services
Various elements are available like Scatterplot, Boxplot, and histograms, which collectively can help six sigma professionals to provide the descriptive statistics of the problem. In short problem solving becomes easy and faster with Minitab.
A question arises: Can’t we use MS excel? Why we need Minitab rather?
1. MS Excel is very good for summarizing and analyzing the data. You can perform sorting, highlighting etc. here.
But when it comes to statistics and specific mathematical functions, it is the only choice. Even the visualization which is specific to statistic context, It offers in a better way. The only thing you need to do is, provide clean raw data, and a few clicks can get you beautiful charts.
For example the Pareto chart. In MS excel drawing it is a nightmare, but in Minitab, that’s easily available.
2. When you have many worksheets and too many charts, that could look cluttered in MS Excel. While it has an option of “Project Manager”, which can help you toggle between spreadsheets, charts and statistical output.
3. MS Excel is a general tool, flexible for use with an extensive variety of applications. However, its focus area is improvising quality of process/product/services with help of statistics, hypothesis testing, statistic visualization etc.
4. MS excels can be used by anyone who wants to understand data or may want to perform some basic steps. On the other hand it is a powerful statistical software package, can be used well by a statistician or some analytical person.
Minitab when opened, typically has three types of windows
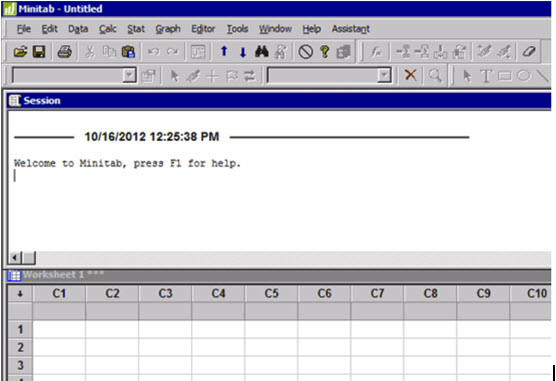
- Session window: This is the topmost window, where it will show the output of your requested statistical analysis.
- Worksheet window: This is the bottom window, where data is copy pasted into a worksheet.
- Graphics window: This is the type of window which is not seen when it opens. This comes only when, it is asked to plot something e.g. Scatterplot, histograms etc. So this is the graphics window.
Key Features of Minitab
Following are the 8 key features mentioned below:
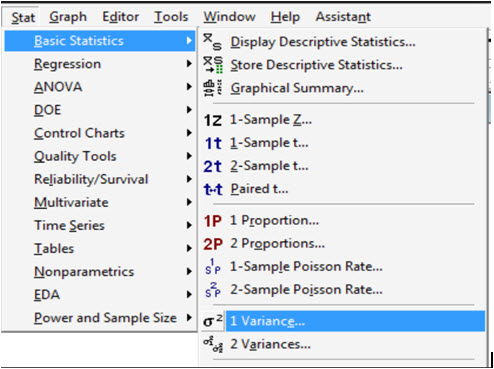
1. Basic Statistics: This feature covers all kind of statistical tests, descriptive statistics, correlations, and covariances.
Stat -> Basic Statistics
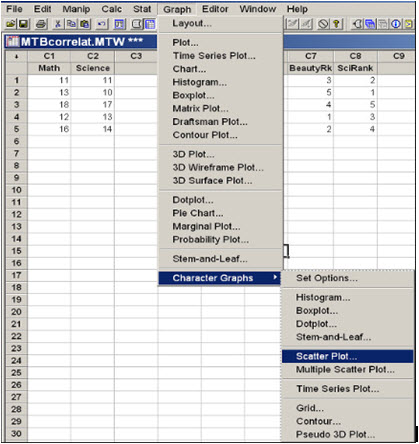
2. Graphics: This enables users to draw various statistical graphs such as scatter plot, histograms, boxplots, matrix plot, marginal plot, bubble chart,s etc.
Graph -> Character Graph
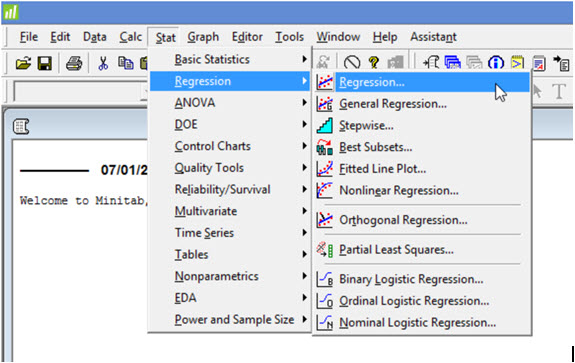
3. Regression: This feature enables users to find the relationship between variables (which is a key feature of any statistical tool). Regression is available in form of linear, non-linear, ordinal, nominal etc.
Stat -> Regression
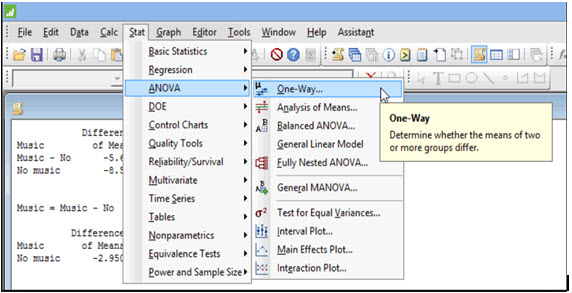
4. Analysis of Variance: Analysis of variance i.e. ANOVA is used to analyze the difference between the group means.
Stat -> ANOVA
5. Statistical Process Control: This feature helps you create cause and effect diagrams, variable control charts, multi-variate control charts, time-weighted charts, etc.
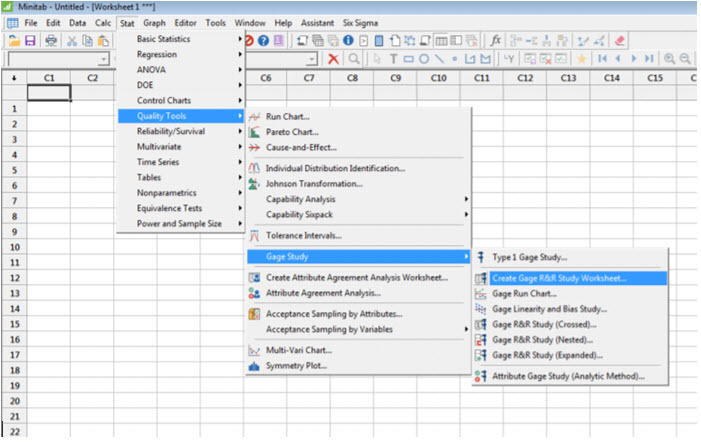
6. Measurement System Analysis: MSA is a mathematical method to determine the amount of variation that exists within a measurement process. Variability in a process can directly impact the overall variance of a process.
Stat -> Quality Tools -> Gage Study
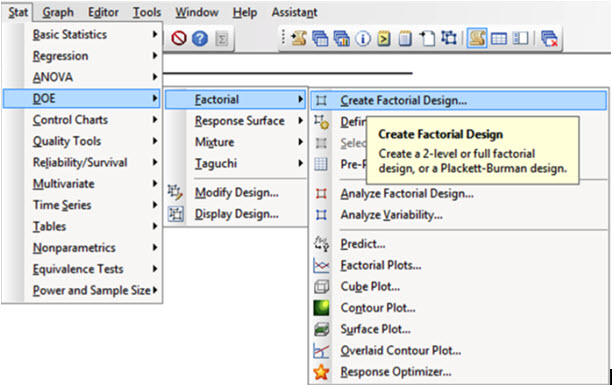
7. Design of Experimentations: This feature helps you identify the cause and effect relationship. This helps in creating and experimenting with various designs by noting down all its relevant outputs. This helps you on finalizing a certain method and optimizing it.
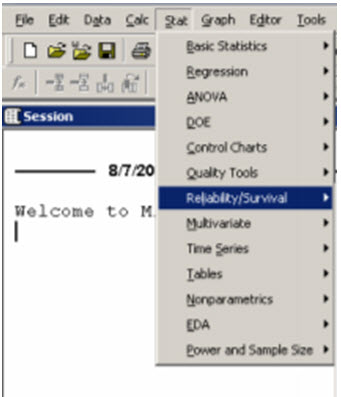
8. Reliability/Survival: It enables you to select the best distribution for modeling data. It helps you in identifying which is the best function that best describes your data.
Stat -> Reliability/Survival
Data types
The data types are explained below.
It recognizes Text, Numeric, and date/time. When data is entered in Minitab, it automatically recognizes its data type. Although we have the flexibility to change the data type.
- Numerical: To perform all statistical calculations, the data column needs to be in numerical format.
- Text: Computation is not done over text format
- Date/Time: It recognizes Date and Time Data Types, but it stores them internally as a number.
Procedure for Minitab
Let us see the procedure to follow for performing the basic statistics.
- First, you need to put your data values in one of the columns of the Minitab worksheet.
- Put a variable name in the gray box.
- Click on “Stat”, then click on “Basic Statistics”, and then click on “Display Descriptive Statistics”.
- Choose the variable for which you want the basic statistics. Click on “Select”.
- Click on the “Statistics” box, then check the box next to each statistic you want to see.
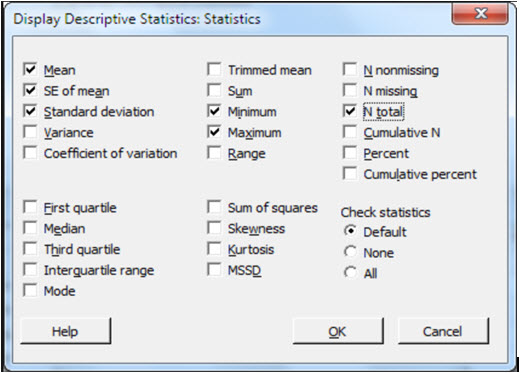
- Click on “OK” in that window, then click on “OK” in the next window.
- The values of all the statistics you selected should appear in the Session window.
In short, it helps organizations and institutions to visualize and analyze the trend to solve certain problems by bringing valuable insights from the data, in a quick and effective way.
Recommended Articles
This has been a guide to What is Minitab?. Here we have discussed basic concept, the procedure, data types different key features of Minitab. You may also have a look at the following articles to learn more –
