Hypothesis Testing Formula (Table of Contents)
What is the Hypothesis Testing Formula?
Before deep diving into hypothesis testing, we need to understand the hypothesis in the first place. In simple language, an idea is an educated and informed guess about anything around you, which can be tested by experiment or observation.
For example, A new mobile variant will be accepted by people; new medicine might work or not, etc. So a hypothesis test is a statistical tool for testing the hypothesis we will make and whether that statement is full or not. We select a sample from the data set and test a hypothesis statement by determining the likelihood that a sample statistics. So If your results from that test are not significant, it means that the hypothesis is not valid.
Formula For Hypothesis Testing:
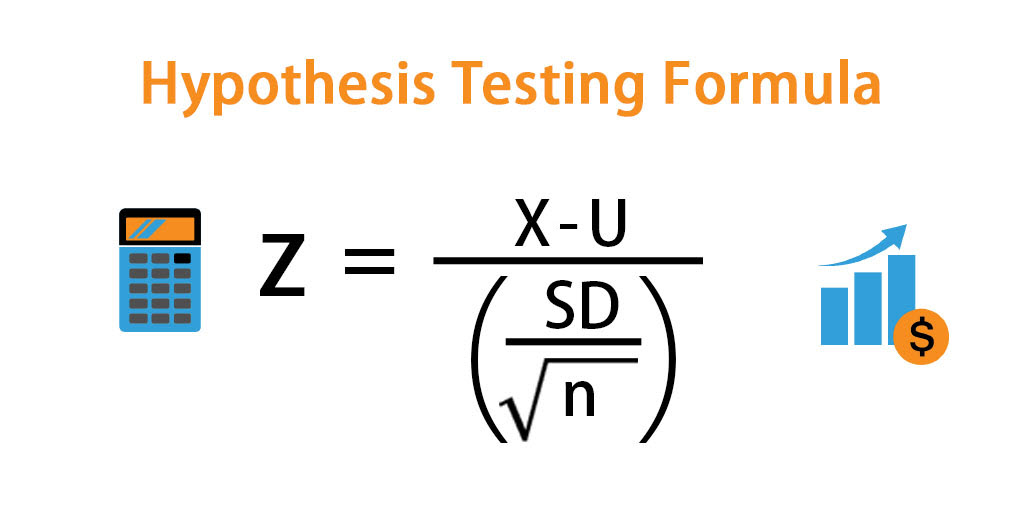
The z-test gives hypothesis testing. The formula for Z – Test is given as follows:
Where:
- X – Sample Mean
- U – Population Mean
- SD – Standard Deviation
- n – Sample size
But this is not as simple as it seems. To correctly perform the hypothesis test, you need to follow specific steps:
Step 1: First and foremost, to perform a hypothesis test, we must define the null and alternative hypotheses. An example of the null and alternate hypothesis is given by:
- H0 (null hypothesis): Mean value > 0
- For this, Alternate Hypothesis (Ha): Mean < 0
Step 2: Next thing we have to do is that we need to find out the level of significance. Generally, its value is 0.05 or 0.01
Step 3: Find the z-test value, also called test statistic, as stated in the above formula.
Step 4: Find the z score from the z table given the significance level and mean.
Step 5: Compare these two values, and if the test statistic is greater than the z score, reject the null hypothesis. You cannot reject the null hypothesis if the test statistic is less than the z score.
Examples of Hypothesis Testing Formula (With Excel Template)
Let’s take an example to understand the calculation of the Hypothesis Testing formula in a better manner.
Hypothesis Testing Formula – Example #1
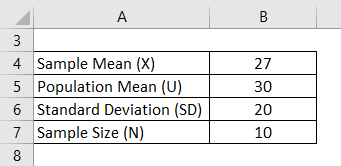
Suppose you have been given the following parameters, and you have to find the Z value and state if you accept the null hypothesis or not:
Solution:
Null hypothesis H0: Population Mean = 30
Alternate hypothesis Ha: Population Mean ≠ 30
Z – Test is calculated using the formula given below
Z = (X – U) / (SD / √n)
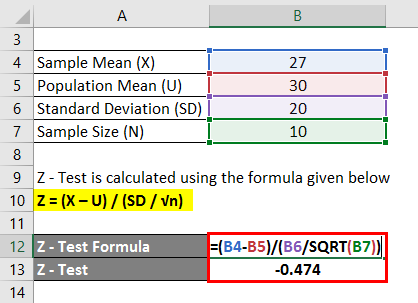
- Z – Test = ( 27 – 30 ) / (20 / SQRT(10))
- Z – Test = -0.474
Level of significance = 0.05
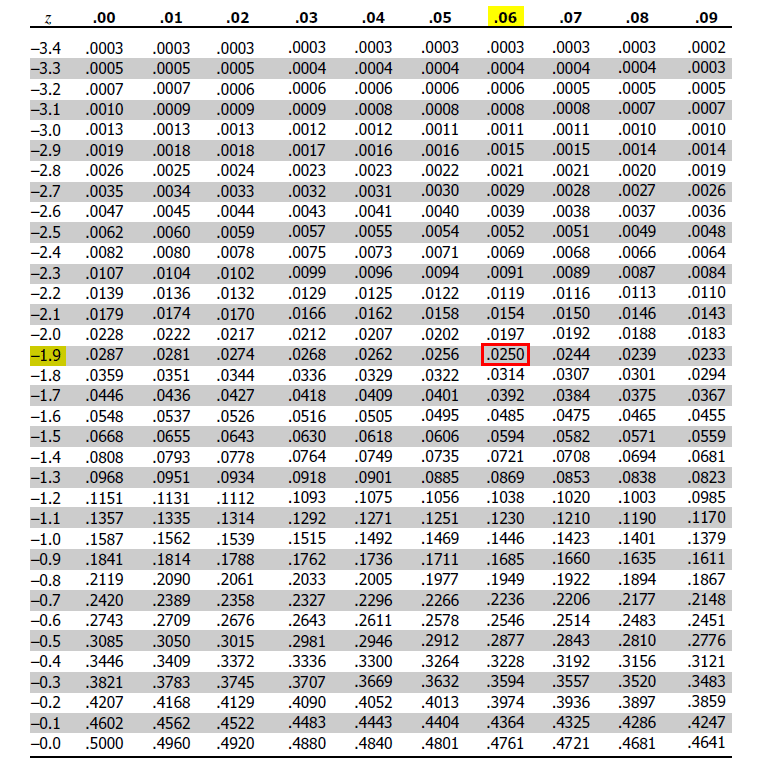
This is a Two tail test, so the probability lies on both sides of the distribution. So 0.025 on each side, and we will look at this value on the z table.
Z table:
Source: https://www.z-table.com/
Since the significance level is 0.025 on each side, we need to find 0.025 in the z table. Once we see that value from the table, we must extract the z value.
If you see here, on the left side, the values of z are given, and in the top row, decimal places are given. So from that, we can say that 0.025 will give a z value of -1.96
So Z – Score = -1.96
We can reject the null hypothesis since the Z Test > Z Score.
Hypothesis Testing Formula – Example #2
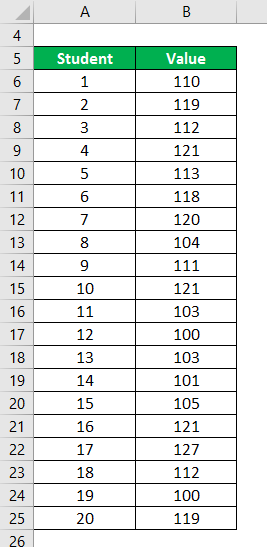
Let’s say you are a school principal; you are claiming that the students in your school are above average intelligence. An analyst wants to double-check your claim and use hypothesis testing. He measures the IQ of all the students in the school and then takes a sample of 20 students. The following are the data points:
Data Set:
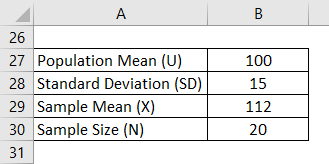
Z – Test is calculated using the formula given below
Z = (X – U) / (SD / √n)
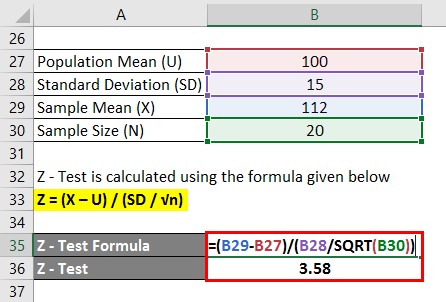
- Z – Test = (112 – 110)/ (15 / SQRT(20))
- Z – Test = 3.58
Null Hypothesis: Since population mean = 100,
- H0 : Mean = 100
- Ha: Mean > 100
Level of Significance = 0.05
Since the significance level is 0.05, we must find 1 – 0.05 =0.95 in the z table. Once we find that value from the table, we must extract the z value.
Z – Table:
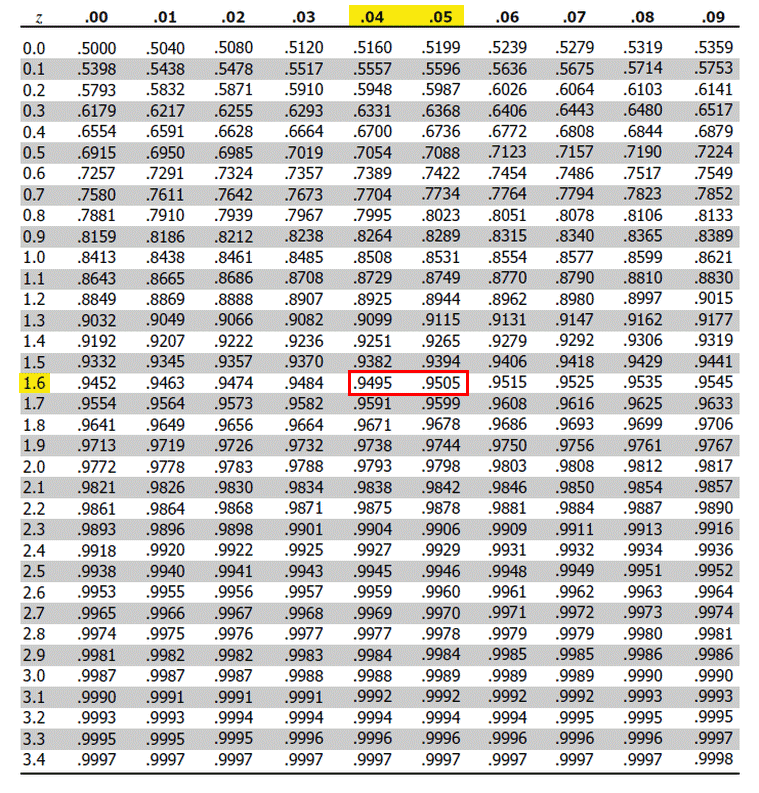
Source: https://www.z-table.com/
If you see here, on the left side, the values of z are given, and in the top row, decimal places are given. So from that, we can say that 0.95 lies between 1.64 to 1.65, mid-point of 1.645.
So Z Score = 1.645
Since the Z Test > Z Score, we can reject the null hypothesis and say students’ intelligence is above average.
Explanation
Everyone should remember that No hypothesis test is 100% correct, and there is always a chance of making an error. There is 2 type of errors that can arise in hypothesis testing: type I and type II.
Type 1: When the null hypothesis is true but rejected in the model. The level of significance gives the probability of this. So if the significance level is 0.05, there is a 5% chance that you will reject the true null.
Type 2: When the null hypothesis is not true but not rejected in the model. The probability of this is given the power of the test. Large sample size can help reduce the probability of this type of error, providing greater confidence in the model.
Relevance and Uses of Hypothesis Testing Formula
As discussed above, the hypothesis test helps the analyst test the statistical sample and, in the end, will either accept or reject the null hypothesis. The test assists in determining the accuracy of the formed hypothesis. If unexpected results occur, it may necessitate the formulation of a new hypothesis, which can then be tested. There are steps for any hypothesis test. The first step is to state the hypothesis, both the null and alternate hypothesis.
The next step is determining all the relevant parameters like mean, standard deviation, level of significance, etc., which helps determine the z-test value. The third step determines the z score from the z table, and for this step, we need to see if it is a two-tail or single-tail test and accordingly extract the z score. The fourth and final step is to compare the results and then, based on that, either accept or reject the null hypothesis.
Hypothesis Testing Formula Calculator
You can use the following Hypothesis Testing Calculator
| X | |
| U | |
| SD | |
| √n | |
| Z | |
| Z = |
|
|
Recommended Articles
This has been a guide to Hypothesis Testing Formula. Here we discuss how to calculate Hypothesis Testing along with practical examples. We also provide a Hypothesis Testing calculator with a downloadable exceExcelplate. You may also look at the following articles to learn more –
