Updated November 27, 2023
Difference Between Variance vs Standard Deviation
Variance vs Standard deviation is the most widely used statistical, mathematical concept. Still, they also play vital roles throughout the financial field, including economics, accounting, and investing.
Dispersion is another statistical jargon that indicates the extent to which the samples or the observations deviate from the central tendency’s measure (which needs to be appropriate). Measures of dispersion will fall into 2 categories, which are
- A relative measure of dispersion and
- An absolute measure of dispersion.
The two types of absolute measures of variability describe how samples or observations are spread out around the average or mean variance and standard deviation. Interpreting variance as the average of the squares of the deviations.
Unlike variance, the standard deviation is the square root of the value (numerical), which shall be obtained while calculating the variance. Most people contrast these 2 mathematical concepts, and we shall discuss the same.
Head To Head Comparison Between Variance vs Standard Deviation (Infographics)
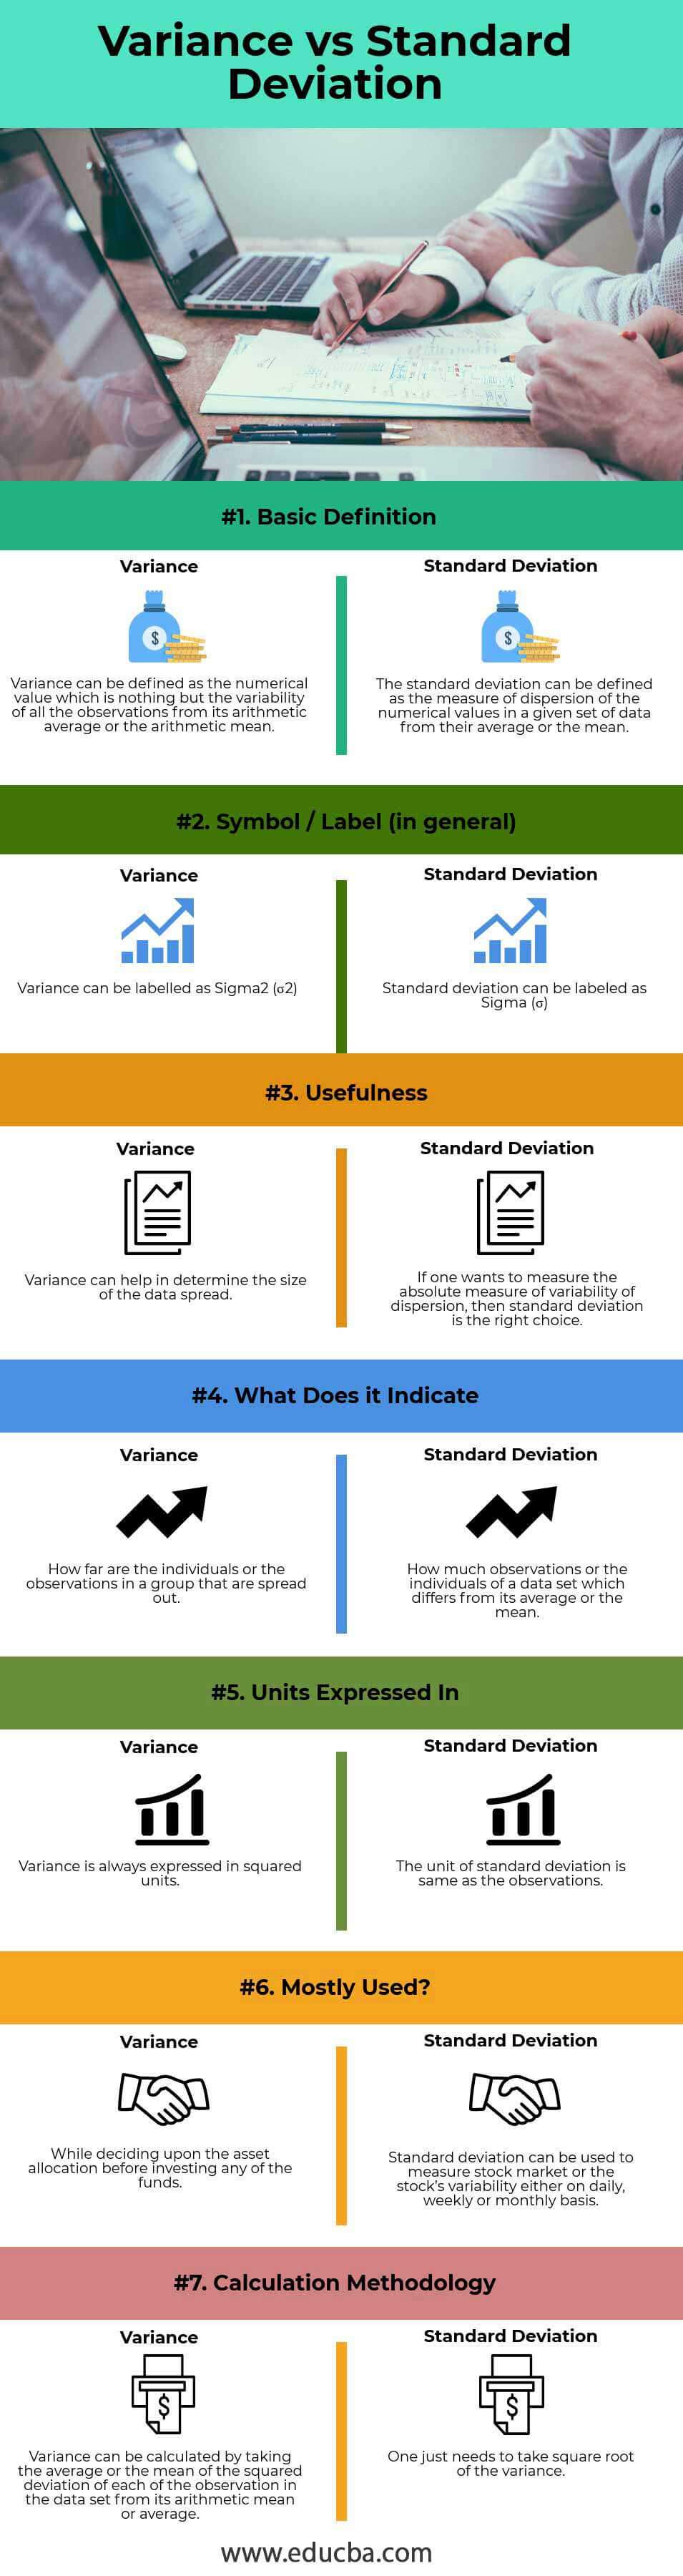
Below is the top 7 difference between Variance and Standard Deviation
Key Differences Between Variance vs Standard Deviation
Both Variances vs Standard Deviation are popular choices in the market; let us discuss some of the major differences between Variance vs Standard Deviation
- Variance is the numerical value that will describe the variability of the individuals or the observations from its arithmetic average of the mean. On the other hand, Standard deviation is another measure of the dispersion of the individuals or the observations within a given set of data.
- Variance, as stated earlier, will measure how far the individuals or the observations in a group or sample are spread out. Conversely, Standard Deviation will measure how much the individuals or the observations of a given data set differ from its arithmetic average or the mean.
- Variance can be denoted or labeled by sigma-squared (σ2), whereas the standard deviation can be denoted or labeled as sigma (i.e. σ).
- Variance, as stated earlier, is nothing but an average or the mean of the squared deviations. Conversely, the standard deviation will be the root mean or average squared deviation.
- The square units always express variance, generally larger or greater than the values of the observations or the individuals in the given data set. Contrastingly, the standard deviation expresses itself in the same units as the values of the observations or individuals in the given data set.
Variance vs Standard Deviation Comparison Table
Below is the 7 topmost comparison between Variance vs Standard Deviation
| Basis of comparison |
Variance |
Standard Deviation |
| Basic Definition | Variance can be defined as the numerical value, the variability of all the observations from its arithmetic average or the arithmetic mean. | The standard deviation measures the dispersion of numerical values in a given data set from their average or mean. |
| Symbol / Label
(in general) |
Variance can be labeled as Sigma2 (σ2) | The standard deviation can be labeled as Sigma (σ) |
| Usefulness | Variance can help in determining the size of the data spread. | If one wants to measure the absolute measure of the variability of dispersion, then the standard deviation is the right choice. |
| What does it indicate? | How far are the individuals or the observations in a group spread out? | How many observations or the individuals of a data set differ from its average or the mean? |
| Units expressed in | Express variance in squared units. | The unit of standard deviation is the same as the observations. |
| Mostly used? | While deciding upon the asset allocation before investing any of the funds. | Standard deviation can measure the stock market or the stock’s variability daily, weekly, or monthly. |
| Calculation Methodology | To calculate variance, take the average or mean of the squared deviation of each observation in the dataset from its arithmetic mean or average. | One just needs to take a square root of the variance. |
Conclusion
Both Variance vs Standard Deviation are common mathematical concepts used in statistics and probability theory to measure the variance or the spread. Variance, as we discussed, is an absolute dispersion measure of how far the observations or the values are spread or they vary in a given set of data from their arithmetic average or the arithmetic mean, whereas standard deviation, on the other hand, is a measure of dispersion (again an absolute measure) of the observations or the values that are relative to the average or the mean.
Variance can be calculated as the average or mean squared deviation of each observation or the value from the mean in a given set of data, whereas the standard deviation is nothing but simply taking the square root of the variance calculated. Earlier, I mentioned that the standard deviation measures of a unit are similar to the average or the mean.
The squared unit of the average or the variance of the mean measure. Both Variances vs Standard Deviations have their purpose. Variance expresses variability in data, while the standard deviation primarily describes data variability in a given set. However, they are similar; the Variance vs Standard Deviation is always positive. If all the given observations in a given data set are similar or identical, the variance and the standard deviation will be zero.
These 2 are the most basic statistical terms, which play an important role in the various sectors. Users prefer standard deviation over the average or the mean because it expresses measurements in units similar to the data. Contrastingly, the given data set typically expresses variance in units greater or larger.
Lastly, these two concepts measure market volatility, which helps create a profitable trade strategy.
Recommended Articles
This has guided the top difference between Variance vs Standard Deviation. Here, we discuss the Variance vs Standard Deviation key differences with infographics and the comparison table. You may also have a look at the following articles to learn more.

