Updated March 14, 2023

Definition of Minitab t test
A hypothesis test of the average with one or more standard normal populations is known as a t-test. The t-resilience study’s against community normality assumptions is an essential feature. To put it differently, t-tests using large sample sizes are frequently acceptable even if the assumption of normality is broken. T-tests are so named as they reduce the sampling data to a single integer, the t-value.
Overview of Minitab t-test
The 1-sample t-test, paired t-test, and 2-sample t-test are all available in Minitab Statistical Software. Let’s take a look at how each of these t-tests lowers a collection of information toward at-value.
- One-Sample T-Test:
The one t-test evaluates the mean of a sample taken to the alternative hypothesis value. For example: Is a female college employee of an institution’s average salary larger than 5.5 dollars?
Explanation: It evaluates a single mean variable equal to a target value.
- Paired t-test:
If the average of the variances among dependent or coupled observations is identical to the desired value, the analysis is passed. For example: Does the mean salary of a female employee of an institution significantly differ from the mean salary of a male employee of an institution?
Explanation: Here it tests the difference between two independent values.
A one-sample t-test analyzes the mean of a single data point to the null hypothesis value. A paired t-test simply determines the differences between the two occurrences (for example, before and after) and then applies a 1-sample t-test to the changes.
- Two-Sample Test:
The 2-sample t-test reduces the sample data from two groups to a single t-value. The technique is quite identical to the 1-sample t-test, and the transmission ratio analogy can still be used. The 2-sample t-test, unlike the paired-samples t, needs distinct groups for every sample.
How to use Minitab t-test?
In this post, we’ll look at how to use Minitab to do a one-sample t-test, as well as how to implement and report the given values. For a one-sample t-test to provide the user with a valid result, we have to see many approaches that the data must meet.
One-Sample Test:
This follows a few predictions to go with the choice of a variable and design.
- 1. The dependent variable needs to be measured on a continuous scale. Temperature is a good example.
- The information provided is unrelated.
- There should be no outliers in the sample.
- The valid outcome should have a normal distribution.
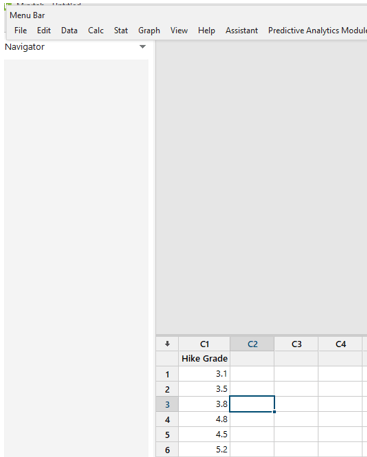
Let’s say 30 of the participants had grade scores that are labeled ‘Hike.’ Assume that a score of 3.0 relates to the word ‘Hike.’ The lower the score, there is no hike, and the higher the score, the more likely people are to hike. As a result, all 30 participants’ scores are calculated, and a one-sample t-test is employed to see if this sample is typical of the general population.
Step-1:
The dependent variable, Hike Grade, is put up in Minitab under column C1. The grade on the dependent variable was then input.
Step-2:
When the four assumptions in the preceding part have still not been violated, this step illustrates how to evaluate the data in Minitab using a one-sample t-test. As a result, below are the three steps needed to execute a one-sample t-test in Minitab:
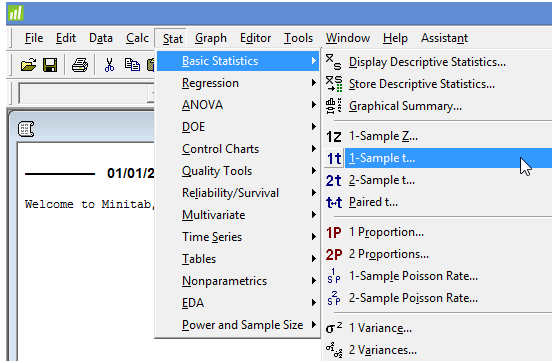
Select Stat- > and navigate to Basic Statistics > 1-Sample t… on the top menu, as shown below:
Step-3:
End up leaving the Samples in Columns option checked and type Hike Grade into the space below. Finally, we’ll get the dialogue box displayed below:
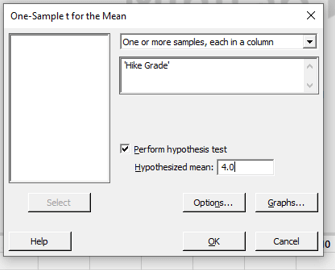
Step-4:
Minitab’s default confidence intervals are 95 percent, which amounts to reporting statistically significant at the p<.05 level.
Step-5:
Select the OK button. Minitab’s output is presented in the image below.
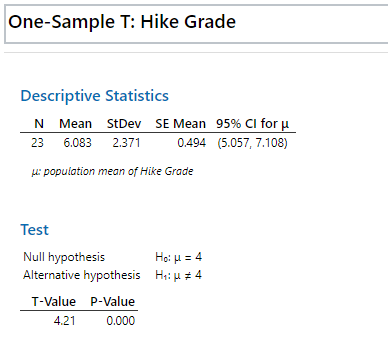
A one-sample t-test was run to determine whether employees’ Hike grade was different to high, defined as a score of 3.0. Mean hike grade (12, 95% CI, 6.67 to 17.1) was lower than the normal hike grade of 4.0, a statistically significant difference, t(3.2) = -2.83, p = .006. If the P-value is less than the significance level, the null hypothesis must be rejected. If the P-value exceeds the significance level, the null hypothesis is not rejected.
How to Run Minitab t-test?
The 2-sample T-test compares two classes within the same categorical variable, which itself is useful when attempting to answer concerns about the effects of adding a program or making a modification to a group of participants.
Example:
Sample data
| Purchase date | 06/05/2016 | 08/02/2014 | 02/01/2016 |
| P1 | 120 | 140 | 80 |
| P2 | 45 | 75 | 65 |
Step-1:
Entering a two-sample test in C1 and C2 for two purchase dates p1 and p2 as shown in the previous example.
Step-2:
Select 2- sample test from stat in the menu bar and give confidence level values and click ok. And the final result is shown here calculating the difference and mean as well.
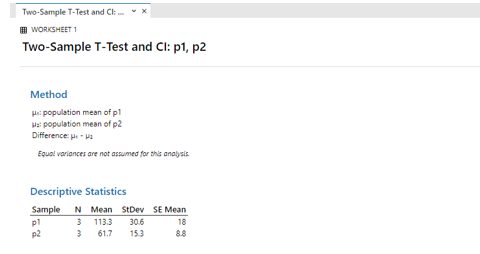
- ii) The information is presented in the table below. The relevance is 0.05, while the confidence interval is 95 percent (1 – 0.05 = 0.95).
| SNO | 1 | 2 | 3 | 4 | 5 | 6 | 7 |
| Asiant Rate | 7735 | 8945 | 7521 | 6545 | 7415 | 9412 | 3212 |
| Nippon Rate | 6542 | 8825 | 7412 | 2312 | 1124 | 3515 | 6389 |
Step-1:
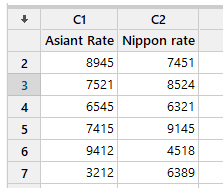
Minitab should now be open. Under C1, put the “After Asianet” data, and under C2, insert the “Nippon rate” data. The result should look like this.
Step-2:
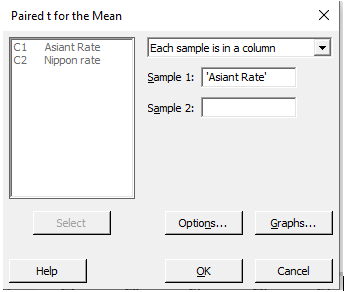
Select Each sample in the same column for a pair-t. Next, enter a value under C1 and C2 for Asian and Nippon rate to check for a normal distribution.
Step-3:
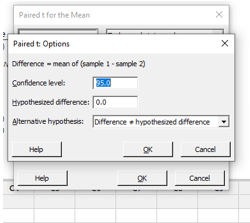
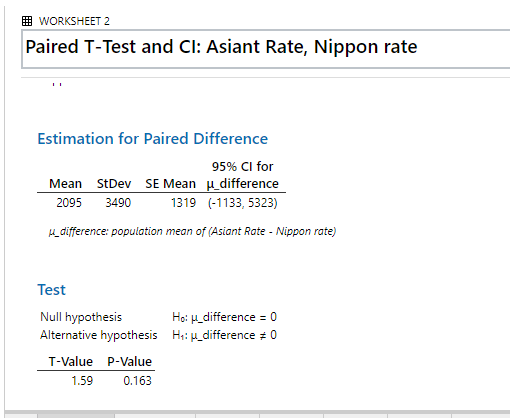
Enter the confidence level value in the tab and click ok. Select “Options…” from the drop-down menu. Besides “Confidence level,” type 95. We write 0 next to “Hypothesized difference:” because we’re checking whether the difference is statistically significant. Then, next to “Alternative hypothesis,” select “Difference postulated difference” from the drop-down box.
Step-4:
When we execute in the Minitab we would get the values like this:
Conclusion
Therefore we have seen different t-test types with an example in a Minitab. This sample is most likely to be representative of the entire population. To better understand the behavior of the parameter, the sample is examined in depth.
Recommended Article
This is a guide to Minitab t test. Here we discuss the definition, overview, How to use the Minitab t-test, examples along with code implementation and output. You may also have a look at the following articles to learn more –
