Minitab Tutorial
Minitab Basic
Minitab Tutorial
Minitab tutorial defines the detailed information of Minitab software. Minitab is the statistical software package used for quality improvement and data analysis. It provides the tool for data visualization, regression analysis, hypothesis testing, process control, and experiment design. Minitab software is commonly used in academia, industry, and research to analyze data to make decisions. Minitab provides online resources and tutorials which help users to learn the software.
Overviews of Minitab Tutorial
The Minitab tutorial provides a step-by-step guide on how we can use Minitab software for the analysis of data. Minitab tutorial covers multiple topics such as the definition of the Minitab tutorial, overviews of the Minitab tutorial, why we need to learn the Minitab tutorial, Minitab applications, Minitab example, prerequisite, and target audience. This tutorial includes a practical example that helps us to understand how we can use the software effectively.
The Minitab tutorial is suitable for beginners and advanced users who want to learn Minitab for statistical analysis. Minitab tutorial has multiple uses in various applications. Minitab software is used to manipulate the data in a worksheet and then we can use the same data for computations. In this article, we have used multiple topics to describe Minitab.
Why do we need to learn Minitab Tutorial?
We need a Minitab tutorial for multiple reasons. The below points show why we need a Minitab tutorial as follows.
- Learn how to use software: Minitab tutorial provides a step-by-step guide on how we can use software efficiently. This is useful for beginners who need to learn how can navigate the interface, and manipulate and enter the data to perform the statistical analysis.
- Saving the time of users: This tutorial helps users to save time by teaching them how we can use software efficiently. By following this tutorial users learn how we can perform analysis accurately.
- Quality Improvement: This tutorial is used to improve the quality like six sigma. Users can analyze the data and make informed decisions to improve the quality of software.
- Academic Research: This tutorial is useful for students who need to analyze the data for academic purposes. While learning how we can use minitab, users perform the statistical analysis and also it will interpret the results accurately.
- Professional Development: This tutorial is used in professional development to improve skills and stay up-to-date with the latest methods. While learning how we can use Minitab, users improve their career job performance.
The Minitab tutorial is essential for everyone who is required to analyze the data for improvement of quality or professional development.
Applications
As we know that Minitab is a statistical software package used for quality improvement in multiple industries such as healthcare, finance, manufacturing, and education. Below are the applications of Minitab as follows.
- Six Sigma: Minitab is used in six sigma, it is a data-driven methodology of quality improvement used to improve efficiency and reduce defects.
- Quality Control: Minitab is used in quality control applications. It is used to control the product's quality and services for analyzing the data and identifying the defects for areas of improvement.
- Statistical Process Control: Minitab is used in statistical process control (SPC), it is a methodology that controls and monitors the processes to ensure that they will remain within the set of acceptable limits.
- Regression Analysis: Minitab is used in regression analysis applications. It is used to perform a regression analysis to identify the relationship between future outcomes and variables.
- Design of Experiments: Minitab is used in the design of experiments, it is a method used to plan and conduct experiments to identify and identify process factors which affect the quality of the product.
- Reliability Analysis: Minitab is used in reliability analysis applications. It is used for reliability analysis to determine the likelihood product or system function for a specified period.
- Data Visualization: Minitab provides the tool to visualize the data and present it in a way that is easy to understand such as boxplots or scatterplots.
- Learn the basics of Minitab: This tutorial is useful to learn the basics of Minitab software, also it will teach the user how can navigate the interface.
- Quality Improvement: We can use Minitab to improve the quality of our software applications. Using Minitab users can analyze the data and also makes informed decisions.
Example
The below example shows how we can use Minitab to conduct the test. For example, we are using sample data.
- In the first step, we need to download and install the Minitab in our system. We can download a free version from the Minitab website.
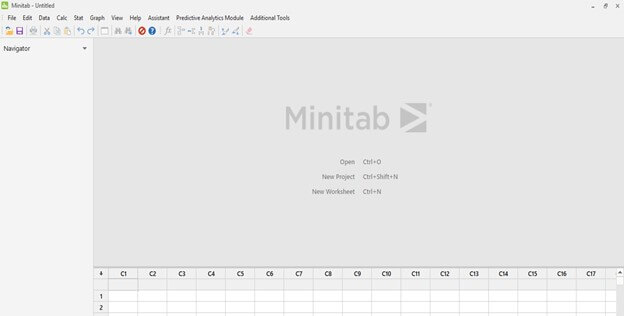
- After downloading the Minitab we need to open the same. The below example shows the GUI of Minitab as follows.
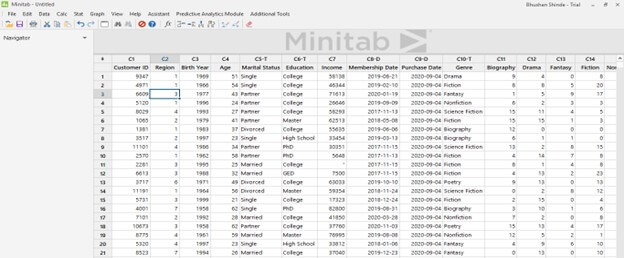
- After opening the Minitab we need to write below in the worksheet for creating the data analysis as follows.
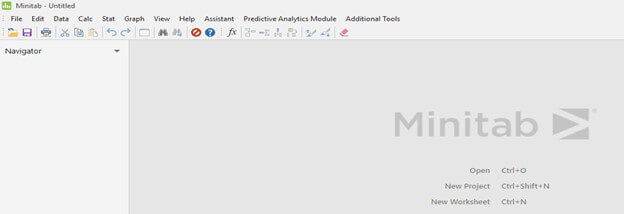
- After creating the worksheet we need to select the stat from the menu bar. The below example shows to select stat from the menu bar as follows.
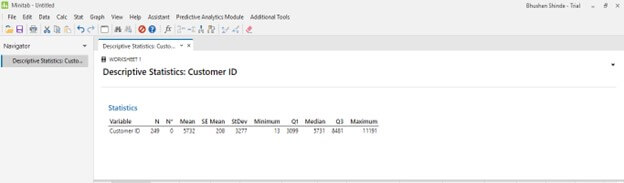
- After clicking on the stat, we need to click on display column statistics and need to check the customer ID column.
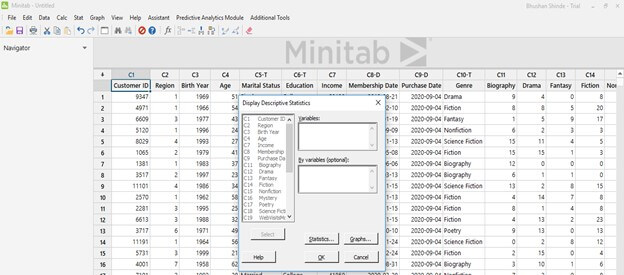
- After selecting the column we need to click on the ok button to generate the statistics as follows.
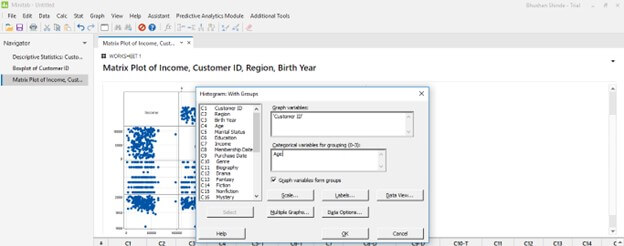
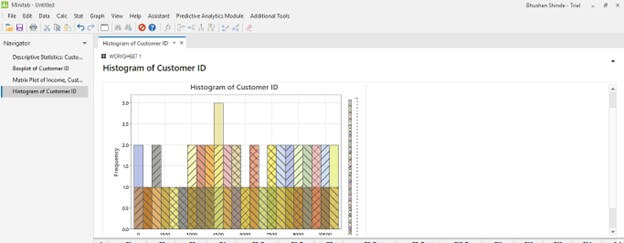
- We can also create the graph of defined data, by selecting the graph option as follows.
Pre-requisites
To follow the tutorial of Minitab we required a basic understanding of statistics such as the concept of the confidence interval, statistical significance, and hypothesis testing. We required a basic understanding of data analysis techniques and data types. Additionally, we have required a basic understanding of how we can use the statistical software package as well as we required some familiarity with the user interface of Minitab.
If suppose we are new to Minitab then we need to start with the introductory tutorials provides by online resources. To follow this tutorial we have also required a basic understanding of application software. A basic understanding of programing language is added advantage.
Target Audience
The target audience of this tutorial varies as per the levels of the specific applications. Specifically, this tutorial is helpful for individuals who want to learn how we can use Minitab for data analysis and modeling. Below is the target audience of the Minitab tutorial as follows.
- Students are taking courses in data analysis and statistics.
- Various industry professionals such as manufacturing, healthcare, finance, engineering, and others need to perform statistical analysis.
- Scientists and researchers need to interpret the results and analyze their data.
- Data analysts who need to manipulate and analyze their large datasets.
- Professionals of quality control who need to improve the product quality and monitor the process of work.
Conclusion
This tutorial includes a practical example that helps us to understand how we can use the software effectively. The Minitab tutorial is suitable for beginners and advanced users who want to learn Minitab for statistical analysis. Minitab software is commonly used in academia, industry, and research to analyze data to make decisions. Minitab provides online resources and tutorials which help users to learn the software.
Valuation, Hadoop, Excel, Web Development & many more.