Ratio Analysis Formula (Table of Contents)
What is Ratio Analysis Formula?
“Ratio Analysis” refers to the analytical technique wherein various financial ratios are computed based on the financial information available in the company’s annual reports or other public domains. Using various ratio analysis formulas helps assess the subject company’s financial and operational position.
It is similar to when you look at your friend’s report card and notice they got an “A” grade in English but a “D” in Math. Logically you will think that your friend could use some help in Math. Similarly, ratio analysis helps understand where a company is performing well and where it might need assistance.
We broadly categorize the financial ratios used in the ratio analysis technique into the following four major categories:
- Liquidity Ratios
- Profitability Ratios
- Efficiency Ratios
- Solvency Ratios
Ratio Analysis Types and Formulas
We calculate the formula for Ratio Analysis by using the following steps:
1. Liquidity Ratios
These ratios indicate the company’s cash level, liquidity position, and capacity to meet its short-term liabilities. The formula of some of the major liquidity ratios are:
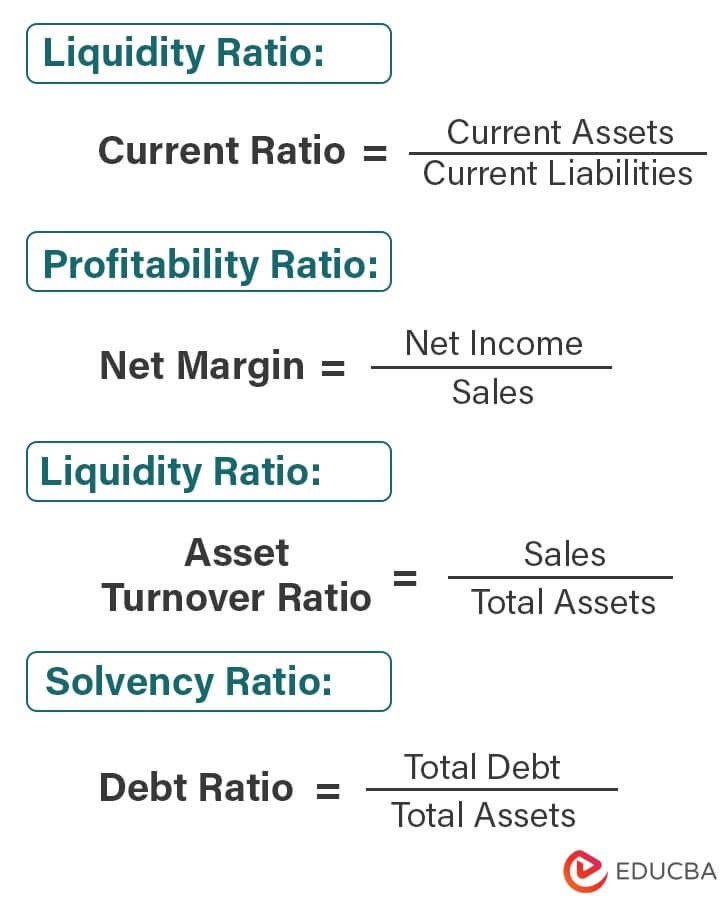
- Current Ratio = Current Assets / Current Liabilities
- Quick Ratio = (Cash & Cash Equivalents + Accounts Receivables) / Current Liabilities
- Cash Ratio = Cash & Cash Equivalents / Current Liabilities
2. Profitability Ratios
These ratios demonstrate a company’s efficiency in using its assets to generate profits. The formula of some of the major profitability ratios are:
- Gross Margin = (Sales – COGS) / Sales
- Operating Profit Margin = EBIT / Sales
- Net Margin = Net Income / Sales
- Return on Total Asset (ROA) = EBIT / Total Assets
- Return on Total Equity (ROE) = Net Income / Total Equity
3. Efficiency Ratios
These ratios indicate how efficiently a company can utilize its available assets or convert its inventories to cash. The formula of some of the major efficiency ratios are:
- Receivables Turnover Ratio = Sales / Accounts Receivable
- Inventory Turnover Ratio = COGS / Inventories
- Payable Turnover Ratio = COGS / Accounts Payable
- Asset Turnover Ratio = Sales / Total Assets
- Net Fixed Asset Turnover Ratio = Sales / Net Fixed Assets
- Equity Turnover Ratio = Sales / Total Equity
4. Solvency Ratios
These ratios indicate whether the company can meet its long-term obligations by comparing its debt level with its assets, equity, etc. The formula of some of the major solvency ratios are:
- Debt to Equity Ratio = Total Debt / Total Equity
- Debt Ratio = Total Debt / Total Assets
- Interest Coverage Ratio = EBITDA / Interest Expense
Example of Ratio Analysis Formula (With Excel Template)
#1 Apple Inc.
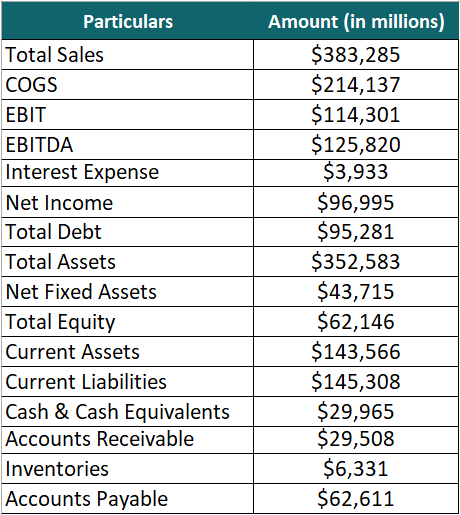
Let us take the example of the latest annual report of Apple Inc. for 2023 to illustrate the calculation of different ratios used in ratio analysis. Based on the given information, let us perform Apple ratio analysis by calculating its liquidity, solvency, efficiency, and profitability ratios for the year 2023.
Given,
Solution:
#1 Liquidity Ratios
1. Current Ratio of Apple
We calculate the Current Ratio using the formula given below:
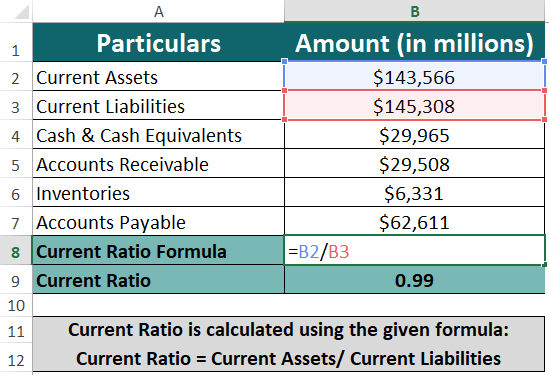
- Current Ratio = $143,566 / $145,308
- Current Ratio = 0.99
2. Quick Ratio of Apple
We calculate the Quick Ratio using the formula given below:
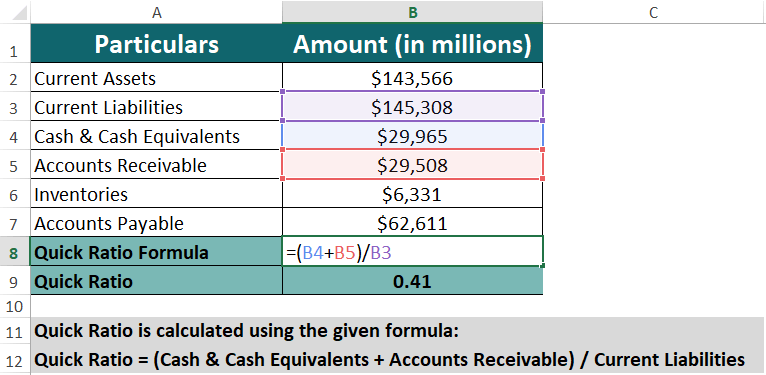
- Quick Ratio = ($29,965 + $29,508) / $145,308
- Quick Ratio = 0.41
3. Cash Ratio of Apple
We calculate the Cash Ratio using the formula given below:
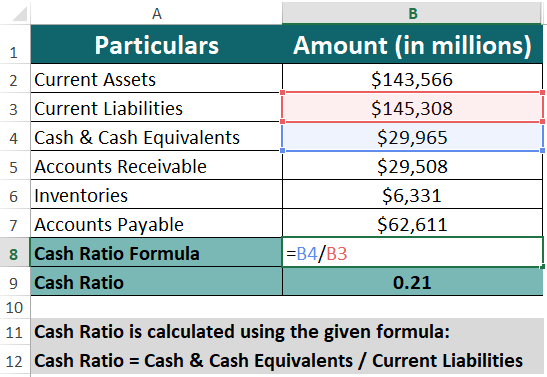
- Cash Ratio= $29,265 / $145,308
- Cash Ratio = 0.21
#2 Profitability Ratios
1. Gross Margin of Apple
Use the below formula to calculate the Gross Margin:
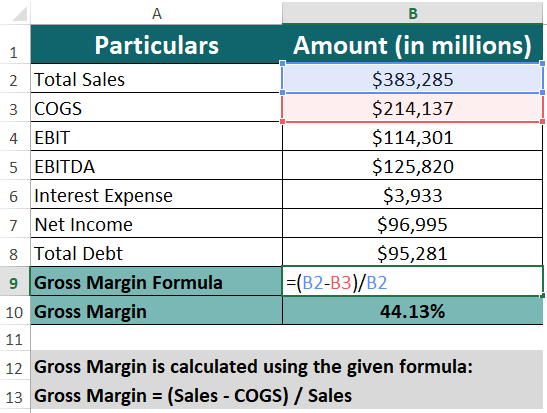
- Gross Margin = ($383,285 – $214,137) / $383,285
- Gross Margin = 43.13%
2. Operation Margin of Apple
Use the below formula to calculate the Operation Profit Margin:
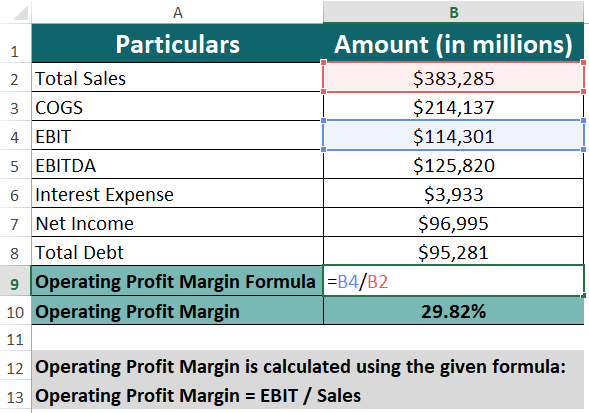
- Operating Profit Margin = $114,301 / $383,285
- Operating Profit Margin = 29.82%
3. Net Margin of Apple
Use the below formula to calculate the Net Margin:
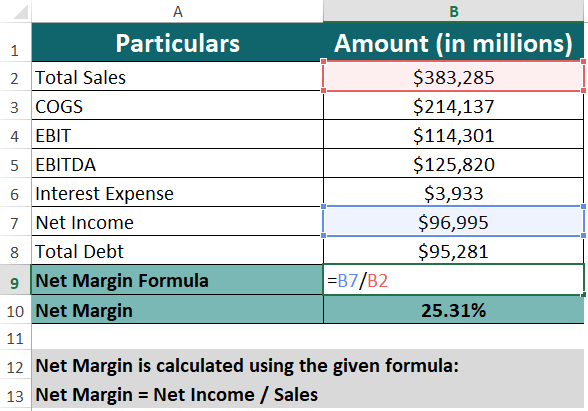
- Net Margin = $96,995 / $383,285
- Net Margin = 25.31%
4. Return on Total Asset of Apple
We can calculate the Return on Total Asset (ROA) using the formula given below:
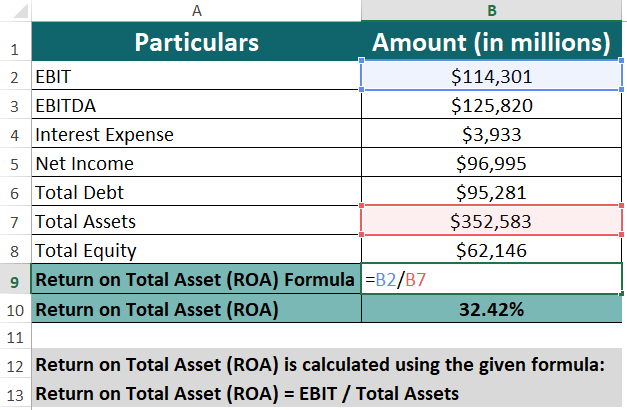
- Return on Total Asset (ROA) = $114,301 / $352,583
- Return on Total Asset (ROA) = 32.42%
5. Return on Equity of Apple
We can calculate the Return on Total Equity (ROE) using the formula given below:
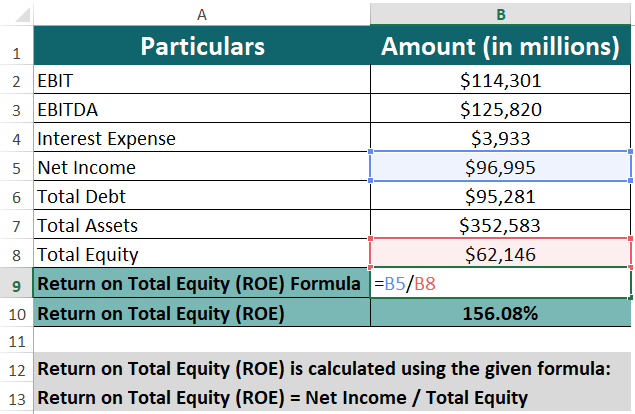
- Return on Total Equity (ROE) = $96,995 / $62,146
- Return on Total Equity (ROE) = 156.08%
#3 Efficiency Ratios
1. Receivables Turnover Ratio of Apple
We can calculate the Receivables Turnover Ratio using the formula given below:
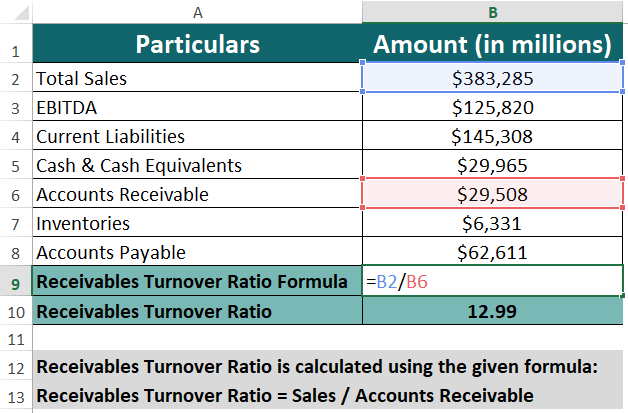
- Receivables Turnover Ratio = $383,285 / $29,508
- Receivables Turnover Ratio = 12.99
2. Inventory Turnover Ratio of Apple
We can calculate the inventory Turnover Ratio using the formula given below:
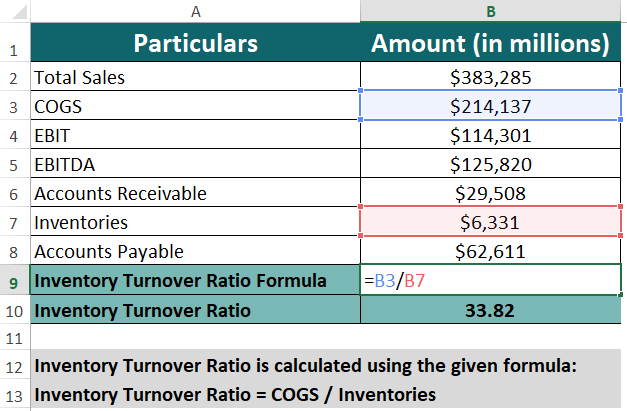
- Inventory Turnover Ratio = $214,137 / $6,331
- Inventory Turnover Ratio = 32.82
3. Payable Turnover Ratio of Apple
We can calculate the Payable Turnover Ratio using the formula given below:
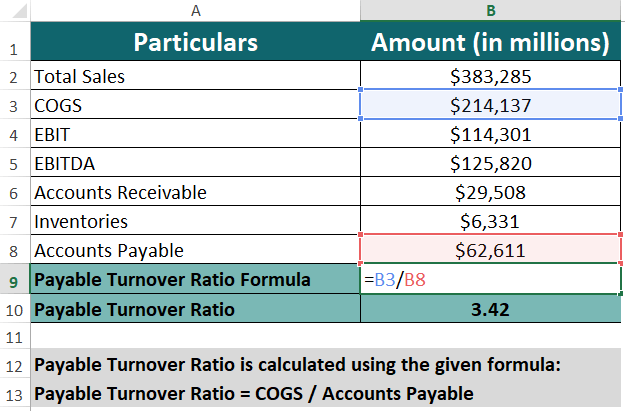
- Payable Turnover Ratio = $214,137 / $62,611
- Payable Turnover Ratio = 3.42
4. Asset Turnover Ratio of Apple
Use the below formula to calculate the Asset Turnover Ratio:
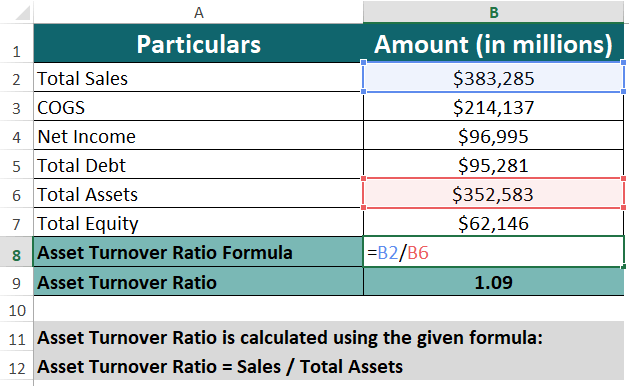
- Asset Turnover Ratio = $383,285 / $352,583
- Asset Turnover Ratio = 1.09
5. Net Fixed Asset Turnover Ratio of Apple
Use the below formula to calculate the Net Fixed Asset Turnover Ratio:
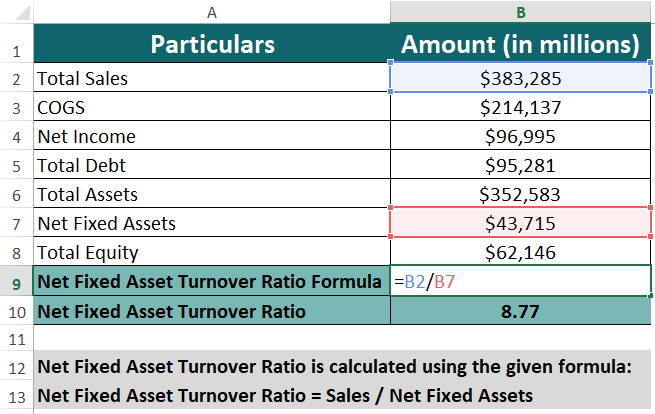
- Net Fixed Asset Turnover Ratio = $383,285 / $43,715
- Net Fixed Asset Turnover Ratio = 8.77
6. Equity Turnover Ratio of Apple
We can calculate the Equity Turnover Ratio using the formula given below:
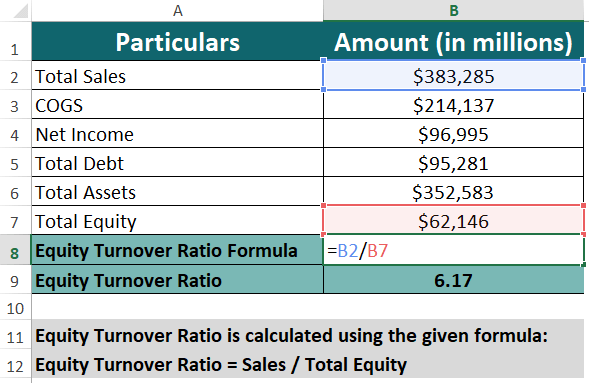
- Equity Turnover Ratio = $383,285 / $62,146
- Equity Turnover Ratio = 6.17
#4 Solvency Ratios
1. Debt to Equity Ratio of Apple
Using the formula given below, we can calculate the debt to Equity Ratio:
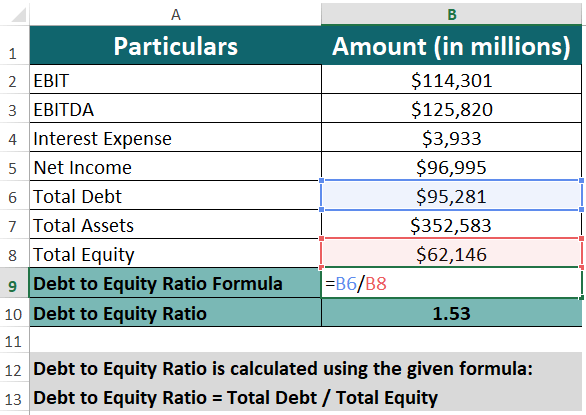
- Debt to Equity Ratio = $95,281 / $62,146
- Debt to Equity Ratio = 1.53
2. Debt Ratio of Apple
Using the formula given below, we can calculate the debt ratio:
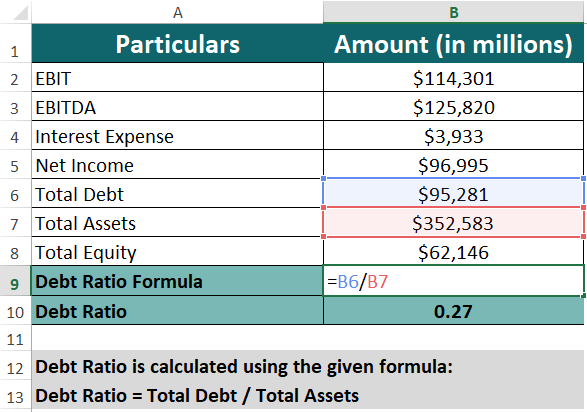
- Debt Ratio = $95,281 / $352,583
- Debt Ratio = 0.27
3. Interest Coverage Ratio of Apple
Using the formula given below, we can calculate Interest Coverage Ratio:
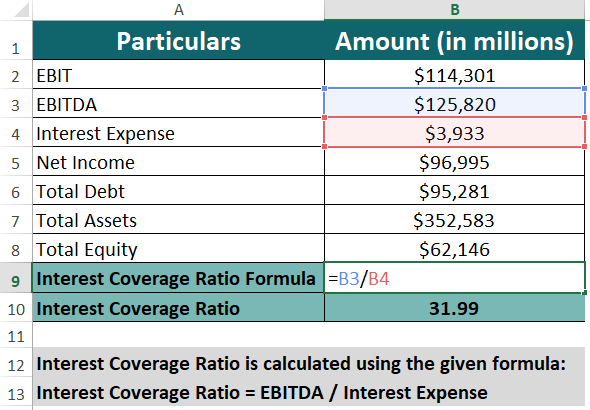
- Interest Coverage Ratio = $125,820 / $3,933
- Interest Coverage Ratio = 31.99
Source Link: Apple Inc. Balance Sheet
Relevance and Use of Ratio Analysis Formula
The relevance of the ratio analysis formula lies in its ability to provide a quick and easy way to assess a company’s financial health and identify potential strengths and weaknesses. Analysts can make informed decisions about whether to invest in a company, lend it money, or engage in other financial transactions by examining ratios such as the current, debt-to-equity, return on assets, and return on equity.
Moreover, its use is widespread in many industries, including banking, accounting, and finance. Banks use ratios to assess the creditworthiness of borrowers, while investors use ratios to evaluate the potential returns on investment. Accountants use ratios to analyze financial statements and identify areas for improvement, such as reducing costs or increasing revenue.
Frequently Asked Questions (FAQs)
Q1. What is the inventory formula in ratio analysis?
Answer: The inventory formula in ratio analysis calculates the inventory turnover ratio. This ratio measures how quickly a company can sell its inventory and is an important metric for assessing its inventory management efficiency.
The formula for the same is:
Q2. What is the net profit formula in ratio analysis?
Answer: The net profit formula is an important financial metric in ratio analysis that measures a company’s profitability. We calculate it by subtracting all expenses, including taxes and interest, from a company’s total revenue.
The formula for calculating net profit is:
In this formula, “Total Revenue” represents all the money a company generates from its sales or services. “Total Expenses” represent all the costs incurred by a company to generate revenue, including operating expenses, taxes, and interest.
Q3. What is the fa/g ratio?
Answer: The FA/G ratio, or the fixed asset to general asset ratio, is a financial ratio used to measure the proportion of a company’s total assets invested in fixed assets. Fixed assets, like buildings, lands, and machinery, are most helpful in a company’s operations for a long time.
The formula for calculating the FA/G ratio is:
Recommended Articles.
It was a guide to Ratio Analysis Formula. Here, we learned to calculate the Ratio Analysis Formula along with a practical example of Apple Inc. We also provide a downloadable Excel template of Apple ratio analysis. You may also look at the following articles to learn more –
