Updated July 25, 2023
Definition of Return on Total Assets
The term “return on total assets” or ROA refers to the financial ratio that assesses the ability of a company to effectively use its available assets to generate earnings.
Simply put, this metric is used to measure the ability of a company to convert its investment in assets into profits. The basic premise for the metric is that it focuses on operating profit rather than the net income to overcome the influences of financing differences and corporate taxation.
Formula
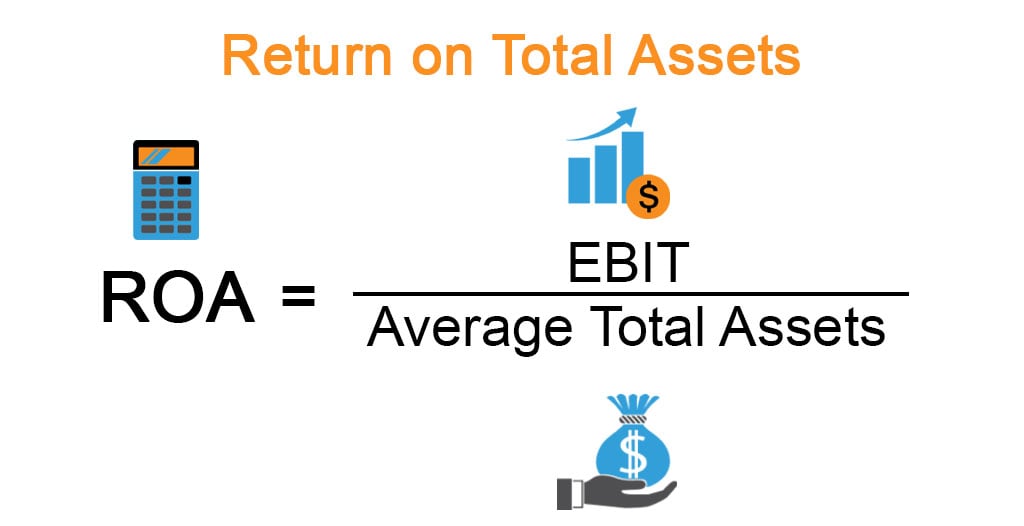
The formula for ROA can be derived by dividing the operating profit or earnings before interest and taxes (EBIT) by the average total assets, which is then expressed in percentages. The mathematical representation of the formula is as below:
The operating profit (EBIT) is usually available as a separate line item in the income statement. Otherwise, the net income can be derived by adding interest expense and taxes. The average total assets are the average value of total assets at the year’s beginning and end.
Examples of Return on Total Assets (With Excel Template)
Let’s take an example to understand the calculation of the Return on Total Assets in a better manner.
Example #1
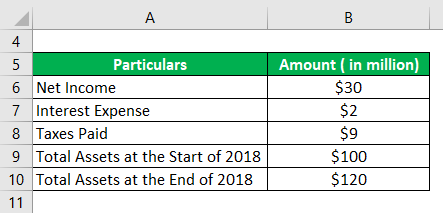
Let us take the example of a company in order to demonstrate the computation of ROA. The company booked a net income of $30 million, while it incurred interest expenses and paid taxes of $2 million and $9 million, respectively, during 2018. The company’s total assets stood at $100 million at the start of the year and ended the year at $120 million. Calculate the ROA of the company for 2018 based on the given information.
Solution:
The formula to calculate EBIT is as below:
EBIT = Net Income + Interest Expense + Taxes Paid
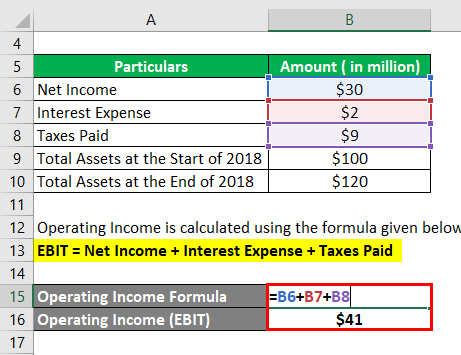
- EBIT = $30 million + $2 million + $9 million
- EBIT = $41 million
The formula to calculate Average Total Assets is as below:
Average Total Assets = (Total Assets at the Start of 2018 + Total Assets at the End of 2018) / 2
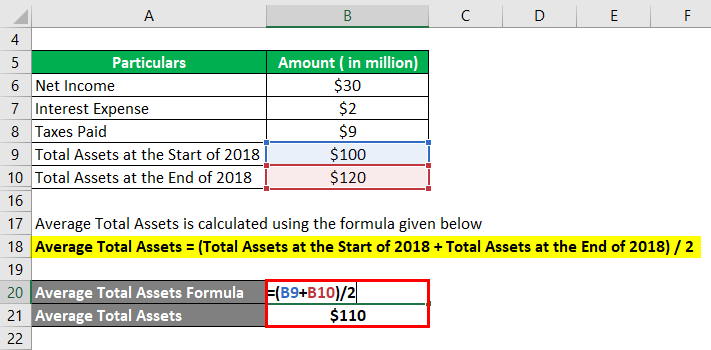
- Average Total Assets = ($100 million + $120 million) / 2
- Average Total Assets = $110 million
The formula to calculate the Return on Total Assets is as below:
ROA = EBIT / Average Total Assets
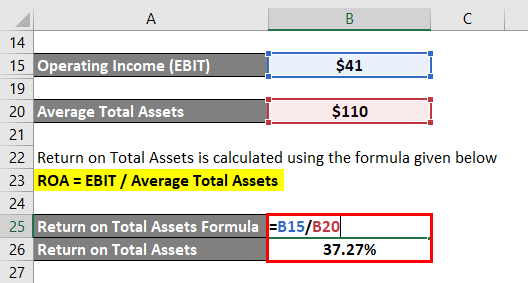
- ROA = $41 million / $110 million
- ROA = 37.27%
Therefore, the company’s ROA for the year 2018 stood at 37.27%.
Example #2
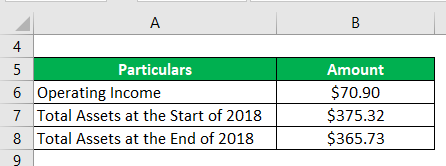
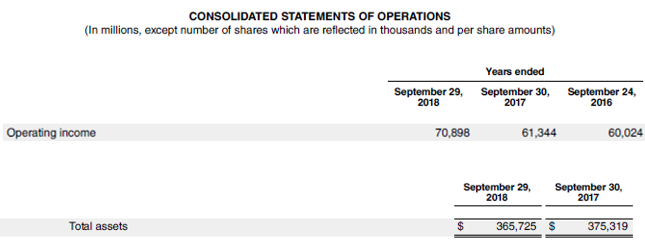
Let us take the example of Apple Inc.’s annual report for the year 2018 to illustrate the concept of ROA. During the period, it generated an operating income of $70.90 billion, while its total assets at the start and end of the year were $375.32 million and $365.73 billion, respectively. Calculate the ROA of Apple Inc. for 2018 based on the given information.
Solution:
The formula to calculate Average Total Assets is as below:
Average Total Assets = (Total Assets at the Start of 2018 + Total Assets at the End of 2018) / 2
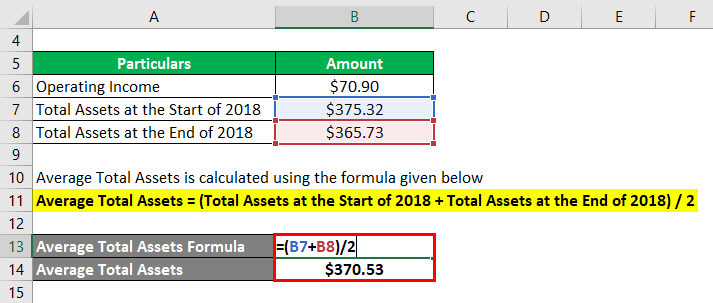
- Average Total Assets = ($375.32 billion + $365.73 billion) / 2
- Average Total Assets = $370.53 million
The formula to calculate the Return on Total Assets is as below:
ROA = EBIT / Average Total Assets
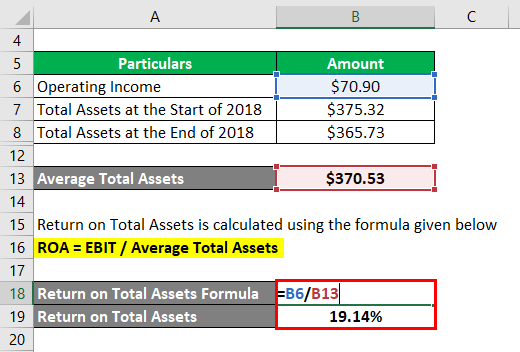
- ROA = $70.90 billion / $370.53 million
- ROA = 19.14%
Therefore, Apple Inc.’s ROA for the year 2018 was 19.14%.
Source Link: Apple Inc. Balance Sheet
Advantages of Return on Total Assets
Some of the major advantages of return on total assets are:
- As the metric uses operating income, it effectively captures the influence of both equity and debt financing on asset purchases and its ability to generate profit. So, companies with different capital structures can be compared without any adjustment.
- It helps in assessing the capability of the company’s management to utilize the available assets.
Limitations of Return on Total Assets
Some of the major limitations of return on total assets are:
- This financial metric is not very useful for companies that belong to capital-intensive industries or service-based companies. Capital-intensive industries must invest a significant portion of the profit in regular Capex requirements resulting in low value. At the same time, service companies have a minimal investment in assets that result in a very high ROA.
- There is a lack of clarity regarding the numerator used in the ratio. Some companies use operating income, while others use net income. As such, peer comparisons among companies with different approaches can be misleading.
Conclusion
So, it can be concluded that ROA is an effective financial performance metric that investors can use to determine the company’s asset utilization and management capability. However, the metric has shortcomings due to a lack of applicability to certain industries and confusion regarding its numerator. So, this metric can be used but with a pinch of salt to avoid misleading results.
Recommended Articles
This is a guide to Return on Total Assets. Here we discuss how to calculate ROA along with practical examples. We also provide a downloadable Excel template. You may also look at the following articles to learn more-

