Updated November 18, 2023
Return on Assets Formula
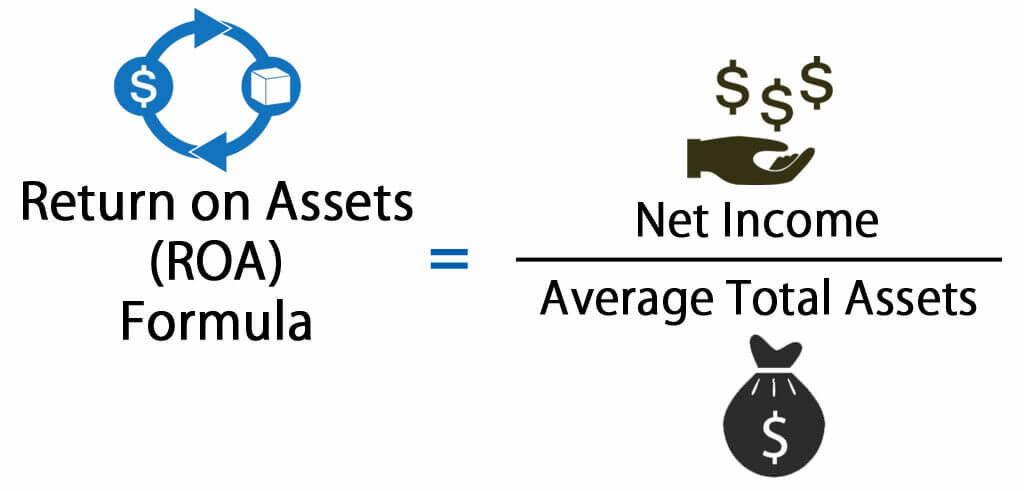
Return on Assets (ROA) Formula can help determine the profitability and efficiency of a business – ROA shows how much money will be earned by investing a dollar of assets.
A higher ROA shows that the company is utilizing its assets efficiently. This ratio shows how well a company performs by comparing its asset investment with its profitability.
The formula for calculating Return on Assets (ROA) is as follows:
Where,
- Net Income: it is equal to net earnings in a financial year.
- Average Total Assets: it is equal to a sum of total assets for the current year and total assets for the previous year divided by two.
Examples of Return on Assets Formula
Let’s see an example to understand Return on Total Assets:
Jagriti Capital Inc. shows a net income of $20 million in current operations and owns $20 million worth of assets at the beginning of the year and $25 million worth of assets at the end of the year as per the balance sheet. Now, what is the return on assets of Jagriti Capital Inc.?
We can calculate the Return on assets by using the formula:
Here,
- Net Income = $20 Million
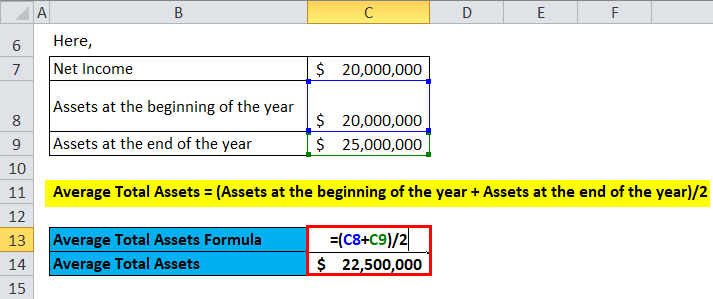
- Average Total Assets = (Assets at the beginning of the year + Assets at the end of the year)/2
- i.e. Average Total Assets = $ (20 + 25) / 2
- Average Total Assets = $ 22.5 Million
Now,
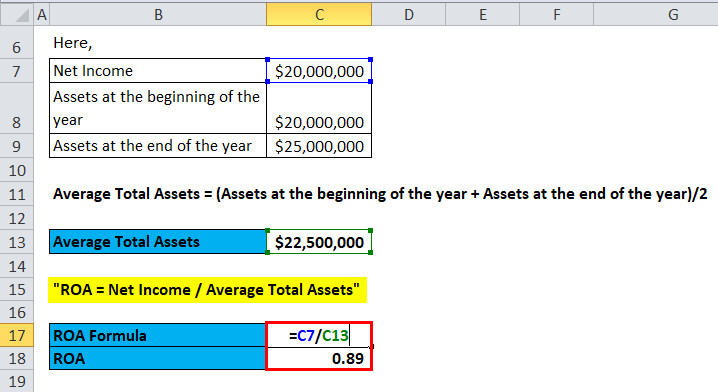
- ROA = Net Income / Average Total Assets
- ROA = $ (20/22.5)
- ROA = 0.89
Explanation of Return on Assets Formula
To Calculate Return on Assets (ROA), we need Net Income and Average Total Assets.
The first component is Net Income.
Net income is the total net amount a company realizes after deducting all the business costs for a given period. It includes all operational and non-operational expenses, tax paid to the government, and interest paid on the debt. Operational costs include the cost of goods sold, the direct cost of production, General administrative & marketing expenses, and depreciation & amortization on fixed assets. Net income also includes any additional income rising through investments or any other source than the company’s primary operations, such as proceeds from the sale of fixed assets. Net income/loss can be found at the bottom of any company’s income statement.
The second component is the Average Total Assets.
Average total assets can be calculated as the sum of assets at the beginning of the year and assets at the end of the year divided by 2. Opening and Closing amounts of total assets are available in any company’s balance sheet.
To calculate the Return on Assets Formula, we must compare the Net Income to the Average Total Assets. i.e., ROA = Net Income / Average Total Assets
Significance and Use of Return on Assets Formula
Return on Assets formula is important for analyzing a company’s profitability. This can be used for comparing a company’s performance with different companies of similar size & industry or else can be used to compare the current performance of the company with its previous performance. Few things to keep in mind before comparing the companies based on Return on Assets. i.e. the companies’ Size, Scale, and Industry must be the same.
Return on assets should not be compared between companies from different industries. The requirement of assets in Companies from different industries may vary. For example, Auto industries require plant, property, and machinery to generate income as opposed to companies in the service industries. Therefore, companies in the auto industry would have a lower return on assets when compared to companies in the service industry, which do not require as many assets as Auto industries. Therefore, return on assets should not be used to compare with companies in a different industry.
Return on Assets (ROA) can help determine the profitability and efficiency of a business – ROA shows how much money will be earned by investing a dollar of assets. A higher ROA shows that the company is utilizing its assets efficiently. Return on Assets (ROA) can be used to determine the company’s structure, i.e., Whether the company is an asset-intensive or an asset-light company.
Asset-intensive companies will have a lower return on assets. Example of Asset-intensive companies is Auto company, Airline company, etc. Whereas an asset-light company will have a high return on assets. An example of an asset-light company can be a software company. As per Industry standards, An Asset-intensive company has a return on assets under 5%, and an asset-light company has a return on assets above 20%.
Return on Assets Calculator
You can use the following Return on Assets Calculator
| Net Income | |
| Average Total Assets | |
| Return on Assets (ROA) Formula= | |
| Return on Assets (ROA) Formula= | = |
|
|
Return on Assets Formula in Excel (With Excel Template)
Here, we will do the same example of the Return on Assets formula in Excel. It is very easy and simple. You need to provide the two inputs, i.e, Net Income and Average Total Assets
You can easily calculate the Return on Assets using the Formula in the template provided.
First, we need to calculate the Average Total Assets.
Then, we calculate the Return on Assets using the formula.
Recommended Articles
This has been a guide to a Return on Assets formula. Here, we discuss its uses along with practical examples. We also provide a Return on Assets Calculator with a downloadable Excel template. You may also look at the following articles to learn more –
