Introduction to Tableau
Tableau has a well-designed interface and quick reports for the Business Intelligence (BI) software package. They provide training from Atlanta to Tokyo online and personally on the platform in towns around the globe. But for every business, Tableau Alternative may not operate. You need to know how to run SQL queries for custom workflows, and it is costly to implement, manage, and maintain.
What is Tableau?
In 2003 tableau was launched. It is a Business intelligence system. It is an intelligence system that allows businesses to visualize and comprehend their information. The solutions enable companies to rapidly connect, visualize and share information from the PC to the iPad, using a revolutionary strategy. You can generate and publish dashboards and share them without programming abilities with partners, classmates, or clients. If you already use a Tableau service, there will be no obstacle in how data can flow seamlessly from one platform to another. Tableau Desktop is an analytical self-service solution that lets you quickly look at information and answer questions. Tableau Server allows you to publish dashboards on any web browser or mobile device on your Tableau desktop.
Top 10 Alternatives of Tableau
Given below are the top 10 alternatives of Tableau:
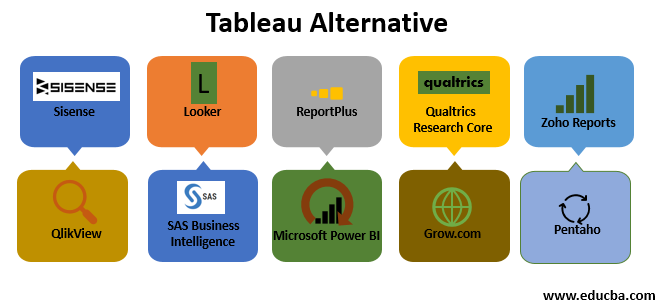
1. Sisense
Sisense is a business intelligence platform that enables customers to add, evaluate and capture data. Then they need to create smarter company choices and formulate workable plans and strategies for their company. With Sisense, users can uniform all data they need and wish via a drag-and-drop user interface to the visually appealing dashboard. You can easily sign up and discover the features without charge and commitment.
Sisense free demo is available on the sites. Sisense helps users to convert information into high-precious ideas and share them through interactive dashboards with friends, company associates, and Clients. It’s the leading company intelligence software for many businesses, including Sony, ESPN, NASA, NASDAQ, and Comcast, from start-ups to developers to Fortune 500. In Sisense, exporting images, Excel, PDF, CSV, and other data formats is possible. Using the calculation and filtering, Sisense identifies important metrics.
2. Looker
This is another alternative to Tableau, which is Looker. An application for information discovery that provides an intuitive approach to information scanning. It offers a web interface to gain insight into your information analysis team’s knowledge. You can easily register for a free Looker demo here to learn more about the features.
Users can readily generate and share reports for other functional organizations, helping companies drive business and choices correctly. Looker also offers flexible pricing and open APIs. To improve customer satisfaction and obtain data from its website traffic, over 700 worldwide businesses use this solution. We can easily operate the looker. It allows and simplifies user cooperation. It is easily integrated into various applications, such as Google Docs and Excel, and even in custom applications.
3. ReportPlus
ReportPlus is another Alternative to Tableau. ReportPlus is a software for data visualization that allows you to view your important business metrics on a centralized platform. You can always monitor and keep up with your company processes results in real-time dashboards, interactive reports, and accessibilities. It can be accessed through any computer, such as Windows or smart devices, iOS, Android, tablets, and Mac desktops.
The cloud solution connects your real-time information to cloud services, on-site SQL databases, and local Excel tablets. It enables the development, evaluation, and self-service BI without the help of an IT professional. The solution on-site is IT-friendly, ensuring uninterrupted installation and maintenance. When it is on-site or in a private cloud, internet accounts are accessible for access throughout your organization.
4. Qualtrics Research Core
Qualtrics Research Core is a market research platform for companies employing over 8,500 brand companies and 100 schools worldwide. This first software option allows users to use AI to analyze survey information to predict market trends and drive better company choices. It comprises the advanced smart features of Qualtrics IQ. For a certain time, you can use all functionality free to see if the software meets your needs.
Qualtrics Research Core can simplify you and optimize it for you whether you wish to follow your consumers’ behavior, compare your business to rivals, undertake scholarly study, test products, or evaluate your advertising attempts. It has specialized and qualified experts accessible 24/7 by telephone, email, and chat. You will not have to worry about long downtimes in this manner. The company offers internal implementation and can also partner with specialist industry companies like Walker, Kantar, and JD-Power.
5. Zoho Reports
This is another alternative to Tableau, which is Zoho Reports. Zoho Reports is Zoho’s software for self-service company intelligence and analysis to generate insightful dashboards and information displays. Zoho Reports is an easy-to-use tool for SMB owners seeking a cheap yet efficient platform for their business needs. Start-ups will enjoy most of its characteristics, among other beneficial company apps, including information visualization and internet cooperation with team members.
A business version is accessible for an increasing business that is more intuitive than most contests. There is easy access to a free trial of Zoho Reports here. Zoho reports allow you to start in a matter of days, easily configured and quickly deployed, thus saving you a lot of time and effort. It is simple to know and use for any company thanks to the spreadsheet-like tool and its intuitive drag & drop-based reports designer.
6. QlikView
QlikView is one of the best alternatives to Tableau with that QlikView is an information discovery product for Business Intelligence (BI) to create directed analytics and dashboards for company problems. The Associative Data Indexing Engine of QlikView allows you to reveal information, ideas, and relations between multiple sources and enhance the quality of your company choices.
QlikView exposes information not disclosed with query-based instruments, contrary to traditional schemes. The instrument also provides guided research, discovery, and cooperative analysis to share perspectives. That makes QlikView ideal for smaller and local businesses and large-scale analysis in all analytical scenarios.
7. SAS Business Intelligence
SAS Business Intelligence is the top ten alternative table in our list of options. SAS Business Intelligence incorporates business intelligence and analytics to detect and retrieve business-level information as part of SAS Enterprise Solutions. It offers usable, self-service instruments and solutions for business intelligence and deploys real-time analysis directly on mobile devices and Microsoft apps.
These features allow you to rapidly view company measures and obtain high-quality and workable information, which allows you to create smart business choices. SAS Visual Analytics is the primary module that allows you to view data, identify relationships and patterns and gain a deep insight into interactive visualizations. You can ask hard questions, irrespective of your ability level.
8. Microsoft Power BI
Power BI is a set of business analysis instruments from Microsoft that provide insights into any company. It lets you connect to hundreds of sources, facilitate information preparation and drive ad hoc analyses, generate lovely reports, and publish them online and across mobile devices for your organization’s consumption. Microsoft Power BI transforms your data into amazing and understandable visuals to make it possible to collect, organize and develop efficient business strategies for you and your businesses. The platform also enables users to monitor their activities and obtain responses quickly through robust and thorough dashboards on each device.
9. Grow.com
Grow is a state-of-the-art company intelligence application for small or medium-sized company managers. The system can fully disperse and rapidly make operative intelligence for sophisticated choice information from many local and third-party sources. Grow brings together all of the main metrics of a lovely and compact dashboard and helps managers create inspirational strategies within a time frame. This is one of the few economically efficient alternatives which give small companies access to a data connector library to adjust their information to the requirements of their business.
10. Pentaho
Pentaho is a business intelligence software. Pentaho was acquired by Hitachi Data Systems in 2015. It provides OLAP services, data warehousing, mining, extracting, transforming, and load processes. It provides features such as the Internet of Things Analytics in which Pentaho uses IoT analytics to deliver business outcomes. It gives Big Data Integration and Analytics. Also, with the help of the Pentaho Data Integration feature.
There is no requirement for coding or complexity to deliver the data. It provides interactive, real-time GUI based visual data analysis and predictive modeling; information dashboards with IT support which is essential in business analytics.
Conclusion – Tableau Alternatives
In this article, we have seen different Tools which are alternatives to Tableau. You can choose tools based on your requirements and the tool’s features. This article will help you to select the tool you need for your projects and applications.
Recommended Articles
We hope that this EDUCBA information on “Tableau Alternatives” was beneficial to you. You can view EDUCBA’s recommended articles for more information.
