Updated July 31, 2023
Profitability Ratios Formula (Table of Contents)
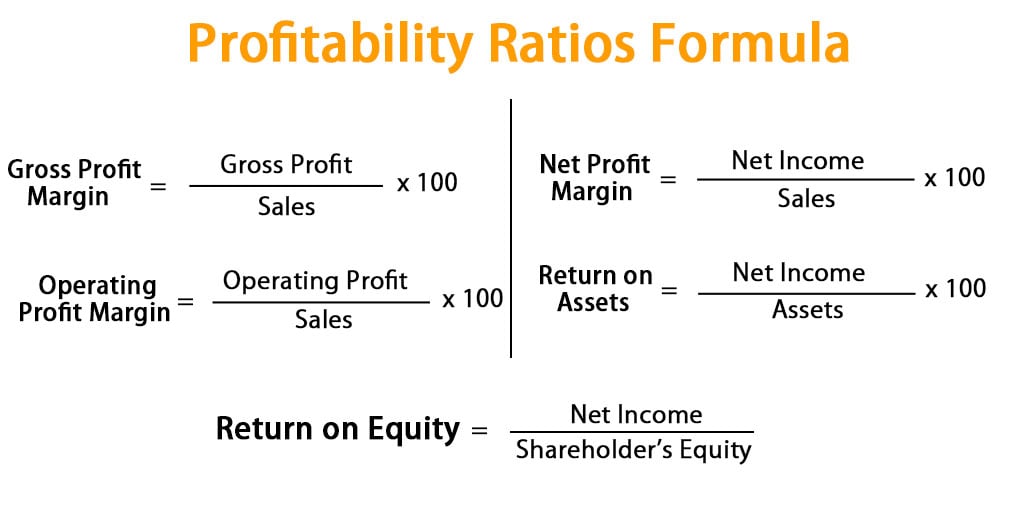
Profitability Ratios Formula
Profitability, as its name suggests, is a measure of profit a business generates. So Profitability ratios are basically a financial tool that helps us measure a business’s ability to create earnings, given the level of expenses they are incurring.
These ratios consider various elements of the Income statement and balance sheet to analyze how the business has performed. The higher the value of these ratios compared to competition and market, the better the business’s performance.
There are various types of Profitability ratios. Let’s see all those ratios one by one :
- Profit Margin Ratios: These ratios compare various profits of the business (gross profit, operating profit, net profit, etc.) with its sales.
Gross Profit = Sales – COGS
Operating Profit = Earnings Before Interest & Tax (EBIT) = Sales – COGS – Operating Expenses
- Return on Assets: This ratio tells us what the return is that which business is generating given the level of assets the business has.
- Return on Equity: This ratio measures the level of return the business produces for each dollar an investor has put into it. So basically, it compares the income with the equity in which investors have invested.
Examples of Profitability Ratios Formula (With Excel Template)
Let’s take an example to understand the calculation of the Profitability Ratios formula in a better manner.
Profitability Ratios Formula – Example #1
A Company ABC Inc. has the following items on its balance sheet. Calculate the profitability ratio formula for the same.
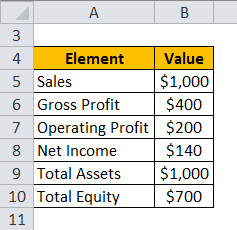
Now let’s calculate Profitability Ratios using the formula.
1. Gross Profit Margin
Gross Profit Margin is calculated using the formula given below
Gross Profit Margin = (Gross Profit / Sales) * 100
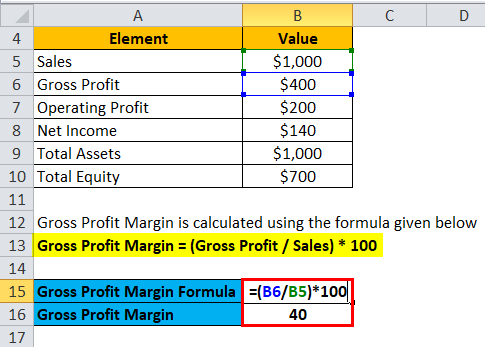
- Gross Profit Margin = ($400 / $1000) * 100
- Gross Profit Margin = 40%
2. Operating Profit Margin
Operating Profit Margin is calculated using the formula given below
Operating Profit Margin = (Operating Profit / Sales) * 100
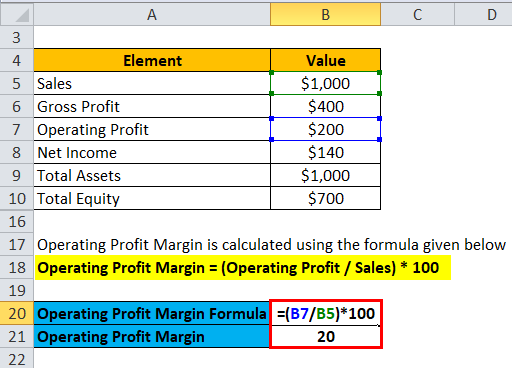
- Operating Profit Margin = ($200 / $1000) * 100
- Operating Profit Margin = 20%
3. Net Profit Margin
Net Profit Margin is calculated using the formula given below
Net Profit Margin = (Net Income / Sales)* 100
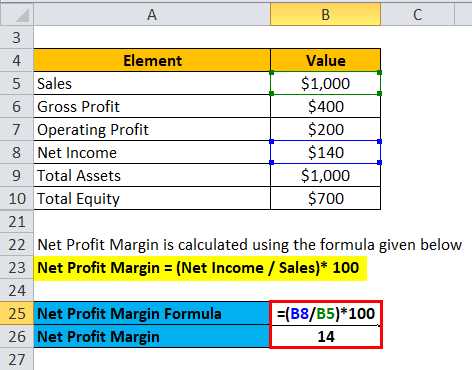
- Net Profit Margin = ($140 / $1000) * 100
- Net Profit Margin= 14%
4. Return on Assets
Return on Assets is calculated using the formula given below
Return on Assets = (Net income / Assets)* 100
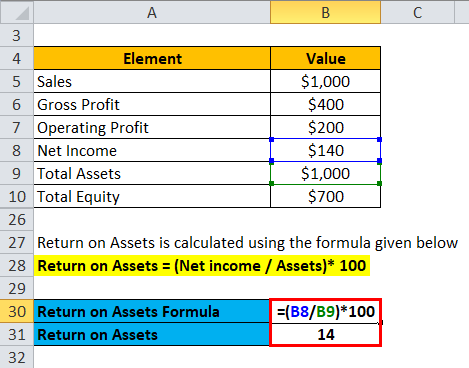
- Return on Assets = ($140 / $1000) * 100
- Return on Assets = 14%
5. Return on Equity
Return on Equity is calculated using the formula given below
Return on Equity = Net Income / Shareholder’s Equity
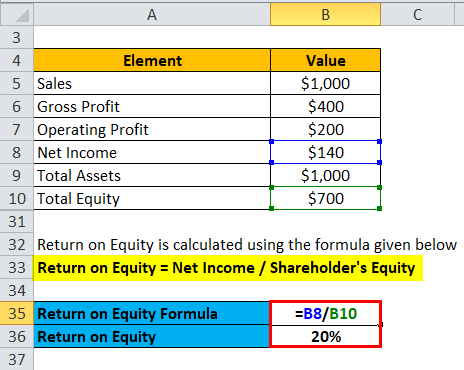
- Return on Equity = $140 / $700
- Return on Equity = 20%
Profitability Ratios Formula – Example #2
Let us look at this industry example to understand Profitability Ratios formula better. I have taken Tata Motors as an example :
Income Statement:
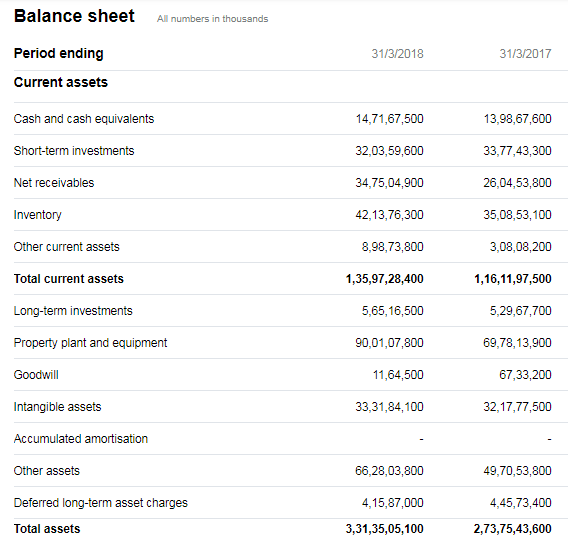
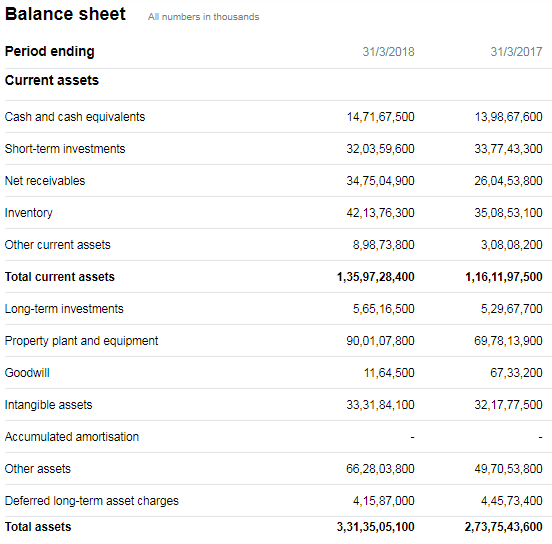
Balance Sheet:
Stockholder’s Equity:
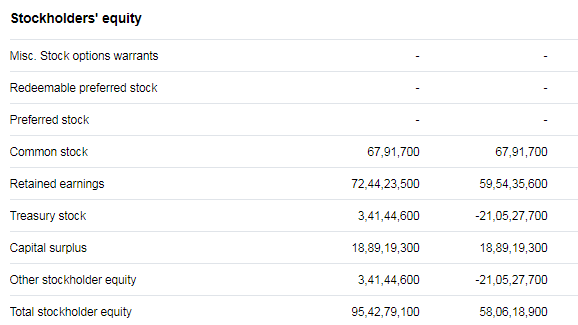
Source: Yahoo Finance
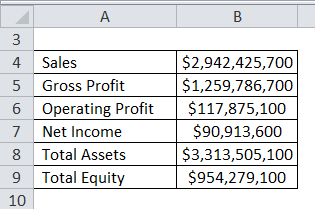
With the help of the balance sheet and Income statement, we have the following information for the year 2018:
Now let’s calculate Profitability Ratios using formula.
1. Gross Profit Margin:
The formula to calculate Gross Profit Margin is as below:
Gross Profit Margin = (Gross Profit / Sales) * 100
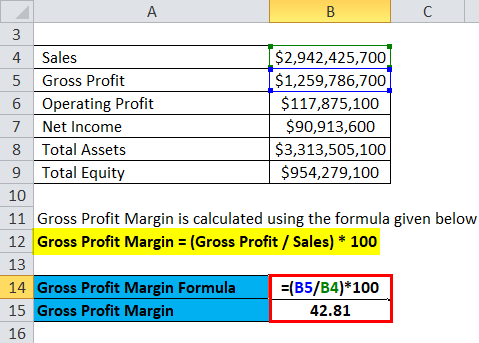
- Gross Profit Margin = ($1,259,786,700 / $2,942,425,700) * 100
- Gross Profit Margin = 42.81%
2. Operating Profit Margin:
The formula to calculate Operating Profit Margin is as below:
Operating Profit Margin = (Operating Profit / Sales) * 100
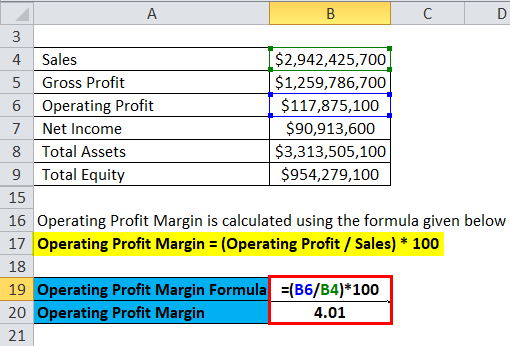
- Operating Profit Margin = ($117,875,100 / $2,942,425,700) * 100
- Operating Profit Margin = 4.01%
3. Net Profit Margin:
The formula to calculate Net Profit Margin is as below:
Net Profit Margin = (Net Income / Sales)* 100
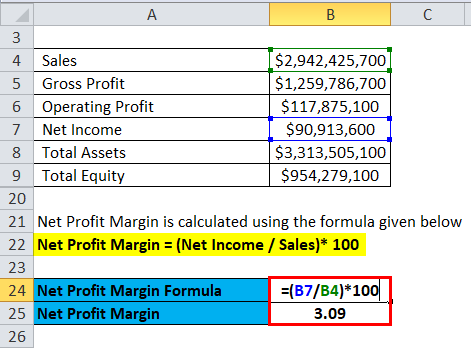
- Net Profit Margin = ($90,913,600 / $2,942,425,700) * 100
- Net Profit Margin = 3.09%
4. Return on Assets
The formula to calculate Return on Assets is as below:
Return on Assets = (Net income / Assets)* 100
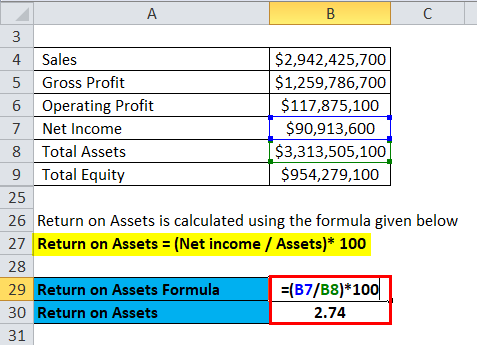
- Return on Assets = ($90,913,600 / $3,313,505,100) * 100
- Return on Assets = 2.74%
5. Return on Equity:
The formula to calculate Return on Equity is as below:
Return on Equity = Net Income / Shareholder’s Equity
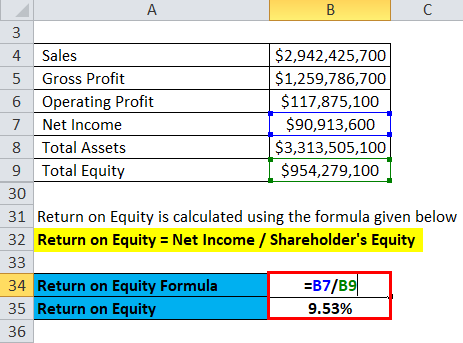
- Return on Equity = $90,913,600 / $954,279,100
- Return on Equity = 9.53%
Things to Remember
- We cannot rely only on gross profit margins; it will not tell us the true story. Since gross margin does not include the operating expenses, sometimes this can be misleading. For example, a Business may have good gross margins, but the net profit margin is not good due to high operating expenses.
- Although the profitability ratios formula helps us to analyze business performance, these ratios are universally comparable. Companies operating in different industries have different ways of operating and different expenses. For example, the Net profit margin of IBM cannot be compared with Starbucks.
- Similarly, a decrease in net profit margin is not always bad for a business that is at a growing stage. Sometimes, business forgoes their profits and margin and give huge discounts to customers to increase their presence in the industry and customers.
- Businesses can artificially inflate the return on asset number by reducing their assets on the balance sheet. One way to do this is by choosing a different depreciation method than the competition. For example, If company A is using a straight-line method for depreciation and B is using the double declining method, B will have a higher ROA in the beginning and lower at the end compared to A
- Sometimes, companies have seasonal sales, and income can vary accordingly. So it is always advisable to compare the profitability ratios of a company with its performance compared to the same period last year.
Relevance and Uses Profitability Ratios Formula
The profitability ratios formula is one of the key tools for financial analysis. Everyone wants to grow their hard-earned money and will not like to invest in businesses that are not sound. For them, profitability ratios are a financial metric to judge businesses’ ability to make profits and be considered a worthy investment.
Investors, portfolio managers, and even people not well-versed in financial knowledge can use this tool to make an informed decision about the performance of the companies where they want to invest. On the same line, the company’s management can also make business-related decisions like expansion, diversification, etc., to improve their profitability.
Recommended Articles
This has been a guide to Profitability Ratios formula. Here we discuss How to Calculate Profitability Ratios, practical examples, and a downloadable Excel template. You may also look at the following articles to learn more –
