What is the Gross Profit Margin Formula?
The gross profit margin formula, which divides the gross profit by net sales, is a vital indicator of a company’s financial health.
A high margin indicates that the company is generating a lot of revenue relative to its costs, which means it has a healthy bottom line (Net Profit). Several factors, such as raw materials costs, the efficiency of production, and pricing strategy, can affect a company’s margin.
The Gross Profit Margin formula is,
For example, according to the Amazon Annual report, their net sales for 2021 are $469,822, and the cost of sales (COGS) is $272,344. As per the formula, Amazon’s gross margin will be 42.02%. It indicates that the company is making a huge margin of profit.
Key Highlights
- The gross profit margin formula is a financial ratio that shows how much money the company makes concerning its sales after reducing production costs.
- A higher margin means that the company is making more money and is in better financial health.
- It is an essential indicator of a company’s financial health and should be monitored closely.
- While net profit margin indicates a company’s overall profitability, gross profit margin determines the firm’s effectiveness in product production and distribution.
Gross Profit Margin Formula
The formula is,
OR
Here,
- Net sales is the total revenue generated by an organization after deducting sales returns, allowances, and discounts.
- Cost of goods sold, also known as the cost of sales, is the cost incurred by the organization in production. It excludes the expenses incurred after the production process, such as marketing and sales.
- Gross Profit is the computation of net sales less the cost of goods sold. It indicates the total profit a company makes after deducting costs incurred.
How to Calculate Gross Profit Margin? Excel Examples
#1. Gross Profit Margin of a Furniture Business
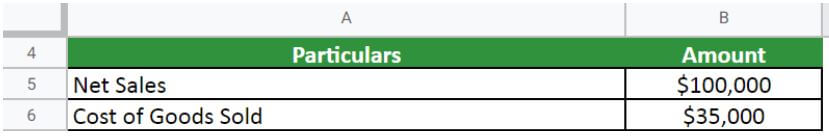
Ms. ABC owns a furniture business that designs and manufactures high-end furniture for offices and residential. She has several different types of furniture and has proven to be one of the most successful brands in her space. Below is the information appearing on the profit and loss statement at the end of the financial year 2022.
- Net sales: $100,000
- Cost of Goods Sold (COGS): $35,000
- Rent: $10,000
- Utilities: $1,000
- Office expenses: $250
Requirements given,
Solution:
First, we should calculate gross profit,
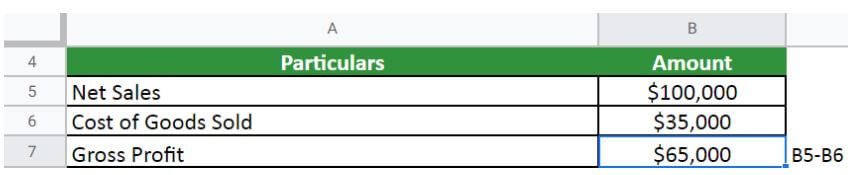
Gross Profit = $100,000 – $35,000 = $65,000
Now, let us calculate the gross profit margin,
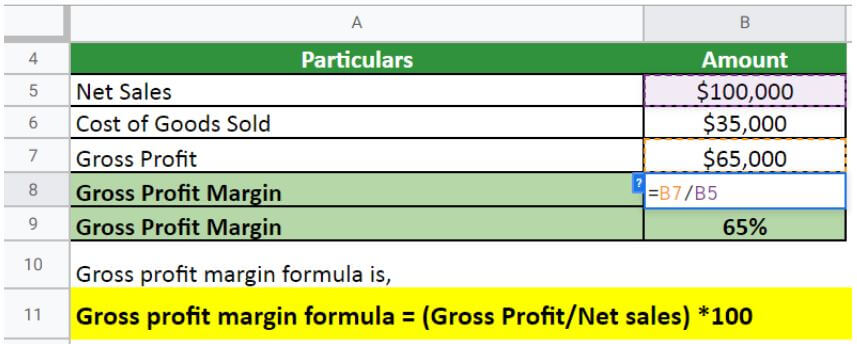
Therefore, Ms. ABC’s gross margin for 2022 is 65%.
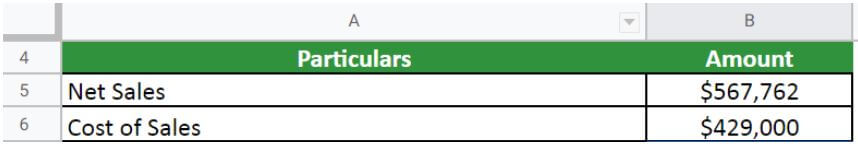
#2. Gross Profit Margin of Walmart
Let’s calculate the gross profit margin of Walmart Inc. for the fiscal year 2021-22.
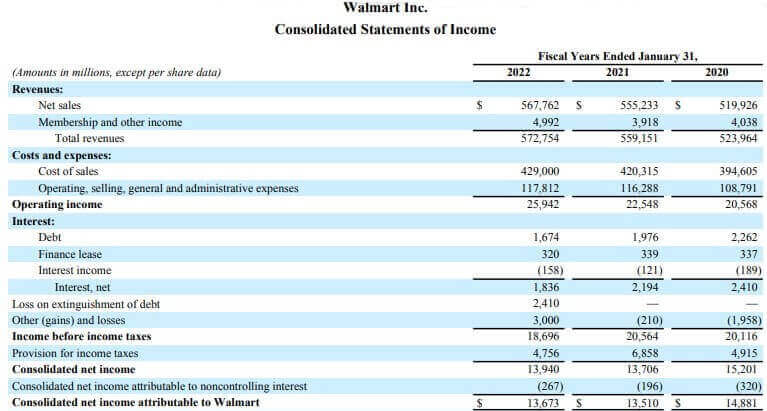
(Image Source: Walmart Annual Report 2022)
Given,
Solution:
Let us calculate the gross profit margin,
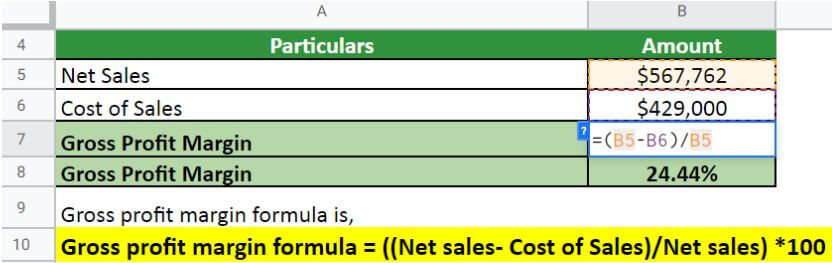
The company has been able to generate a gross profit margin of 24.44%. It is an ideal profit margin for businesses operating in the retail market.
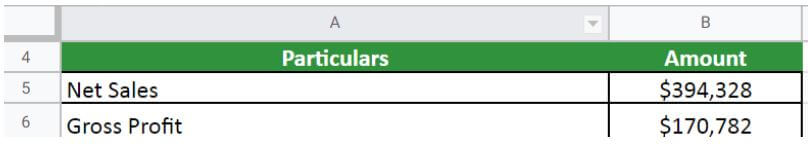
#3. Gross Profit Margin of Apple Inc.
Let’s calculate the gross profit margin of Apple Inc. for the fiscal year 2021-22.
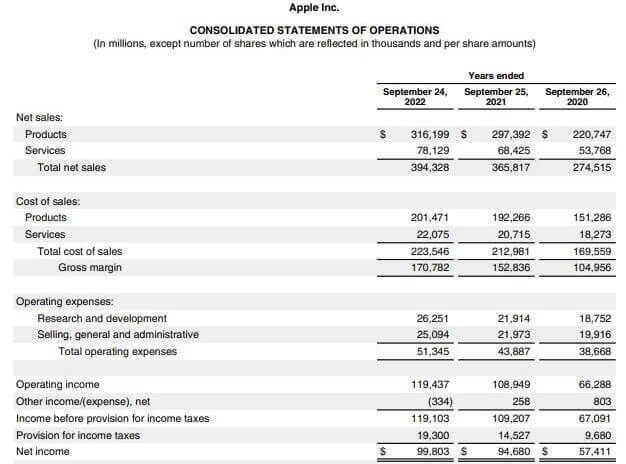
(Image Source: Apple Annual Report 2022)
Given,
Solution:
Let us calculate the gross profit margin,
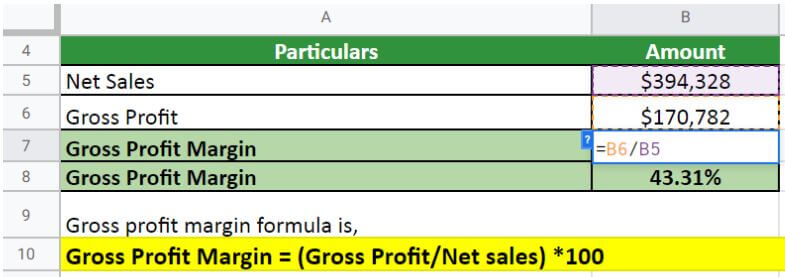
The company has been able to generate a gross profit margin of 43.31%, which is far better than other business organizations operating in the technology industry.
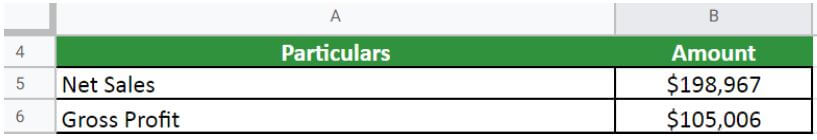
#4. Gross Profit Margin of H&M
H&M is one of the most popular business organizations operating in the clothing industry. Let’s calculate the gross profit margin of H&M for 2021.
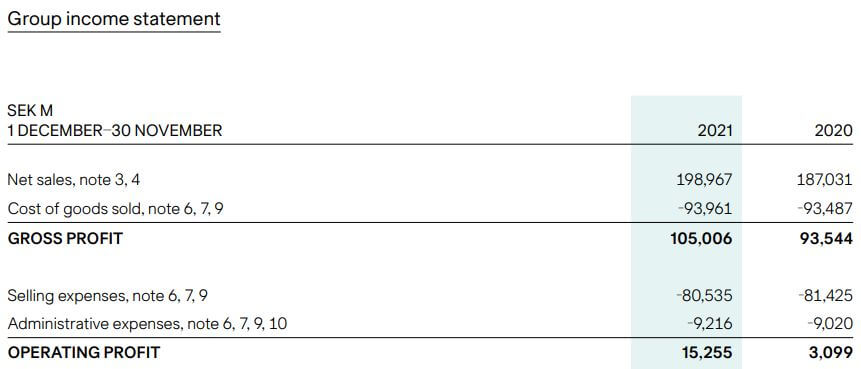
(Image Source: H&M Annual Report 2021)
Given,
Solution:
Let us calculate the gross profit margin,
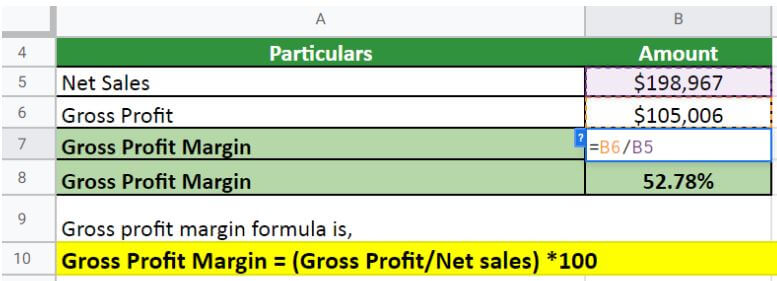
The gross profit margin for H&M is 52.78% for 2021. As per the textile industry, this margin level considerably falls in the higher range. It means H&M is doing well in the business.
#5. Gross Profit Margin of Microsoft
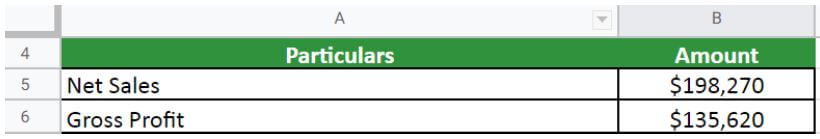
Microsoft is one of the most popular and high-revenue-generating companies in the world. Let’s calculate the gross profit margin of Microsoft for 2022.
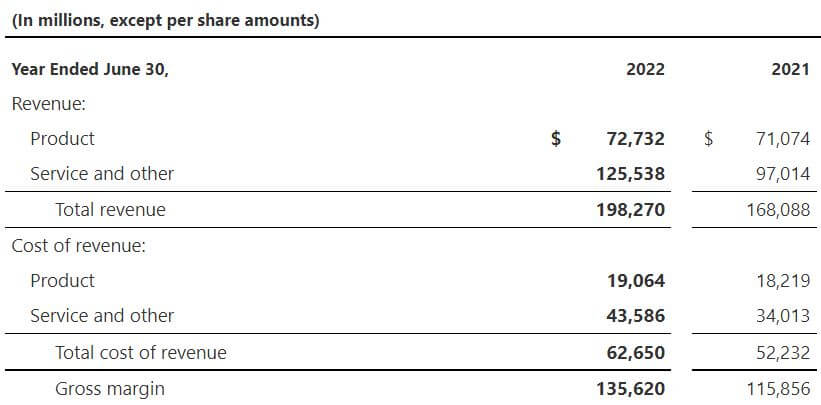
(Image Source: Microsoft Annual Report 2022)
Given,
Solution:
Let us calculate the gross profit margin,
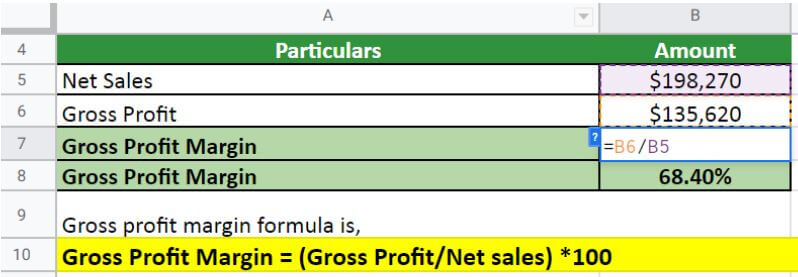
The gross profit margin of Microsoft is 68.40%. While the margin for various technology companies has been declining, Microsoft has a margin of more than half, which indicates that the company is stable in the fluctuating markets.
Significance and Uses
- This concept is fundamental to management, cost accountants, and investors because it allows them to forecast future activities and create budgets.
- Investors also use it to measure the scalability of the business.
- It helps compare a company to its competitors or other companies. Thus, investors use it to compare margins between peer companies regardless of their sales volume or size.
- Good margins business investors can run different models with their margins to compare how profitable the company would be at different sales levels.
What Does the Margin Indicate?
- The gross profit method is essential because it shows investors and management how efficiently the business can produce and sell products.
- It also indicates the profitability of a product or service.
- A high margin indicates that the company is selling its products at a higher price than its competitors, has a lower cost of goods sold, and can generate profits even after accounting for the cost of its goods.
- A low margin indicates that the company has a lower product pricing and higher COGS and is struggling to generate profits.
What Is a Good Margin Value?
- A good margin value varies depending on the industry, but a general rule is that a company should have a gross margin of at least 10%.
- Some analysts consider 25% to 50% a good ratio range.
- Some industries, such as grocery stores, have much lower margins because they operate on fragile margins.
- Several factors can affect a company’s gross margin, such as pricing, product mix, and production costs.
- Usually, the higher the margin, the better your company is doing.
- A company can increase its value by increasing its prices or decreasing its costs.
Gross vs. Net Profit Margin
| Gross Profit Margin |
Net Profit Margin |
|
Definition |
|
| A profitability ratio that determines the relationship between a company’s gross profit and net sales. | A profitability ratio calculates the total profit generated over total revenue. |
|
Formula |
|
| It divides the gross profit by the net sales, where gross profit is the subtraction of COGS from net sales. | It is the division of the net income by net sales. |
|
Indicates |
|
| It measures the firm’s efficiency in producing cost-friendly products and selling strategically to make profits. | It measures a company’s ability to generate profits and indicates its overall profitability. |
|
Good Value |
|
| A good ratio can be between 25% to 50%. However, it can go lower depending on the firm and industry. | A 10% ratio signifies average profit, while 20% can be a good profitability indicator. |
Gross Profit Margin Formula Calculator
You can use the following Gross Profit Margin Calculator using COGS.
| Net Sales | |
| Cost of Goods Sold | |
| Gross Profit Margin = | |
| Gross Profit Margin = | ((Net Sales - Cost of Goods Sold) / Net Sales) * 100 |
| = | ((0 - 0) /0) * 100 = 0 |
Final Thoughts
The gross profit margin formula computes the critical metric that assesses a company’s financial health. By tracking the gross margin, investors and analysts can better understand a company’s profitability and overall financial stability. While it can fluctuate every month or year, it is important to track trends over time.
Frequently Asked Questions (FAQs)
Q1. What does a 20% gross profit margin mean?
Answer: A 20% gross profit margin means that for every $100 in revenue, the company makes $20 as profit. It is also known as gross margin. To calculate it, divide the company’s gross profit by its total revenue. A higher gross profit margin is usually better because it indicates that the company is efficient at converting income into profit.
Q2. Can gross profit be negative?
Answer: Yes, gross profit can be negative. It can happen when a company’s costs of goods sold are higher than its revenue. A negative gross profit margin indicates that a company is not making enough money to cover its production costs. It can be a sign that a company is in financial trouble and may not be able to stay in business for long.
Q3. Can the gross margin be more than 100?
Answer: No, the gross margin cannot be 100%. Gross margin is the difference between a company’s revenue and its cost of goods sold (COGS). COGS includes the direct costs associated with producing the goods or services that the company sells. Therefore, the gross margin will always be lower than 100%.
Q4. Why is gross margin important?
Answer: Gross margin is essential because it represents a company’s profit after accounting for the cost of goods sold. A company with a high gross margin is profitable and can reinvest profits into the business or pay dividends to shareholders. A company with a low gross margin may not be beneficial and must take on debt to finance operations.
Gross margin is also a key metric for comparing companies in the same industry. A company with a higher gross margin than its competitors has a competitive advantage. Investors often use gross margin to assess a company’s financial health. A company with a declining gross margin may be in trouble and is a less attractive investment.
Q5. Should gross margin be high or low?
Answer: There’s no easy answer to this question, as the ideal gross margin will vary depending on the specific business and industry. In general, a higher gross margin is usually better than a lower one. A higher gross margin indicates that a company can generate more revenue from its core product or service offerings.
It can signify strong demand for the company’s products or efficient operations. A low gross margin, on the other hand, may indicate that a company is struggling to generate profits from its core offerings. Of course, there are exceptions to every rule. In some cases, a low gross margin may be acceptable if it allows a company to offer its products at a competitive price.
Q6. Where to find gross margin on financial statements?
Answer: The gross margin is not present in the financial statements. However, the variables to calculate it, such as net sales, COGS, and gross profit, are available in the company’s income statement.
Recommended Articles
This is a guide to the Gross Profit Margin formula. Here, we have discussed its uses along with practical examples. We also provide you with a gross profit margin calculator along with a downloadable Excel template –
